










































What We Do

Café investment clarity,
modelled to the rupee.

From first-rupee setup cost to break-even day, the Modern Café Investment Analyzer gives founders and operators a live, adjustable financial model covering capital, revenue, margins, and partner splits. No spreadsheets. No guesswork.

Overview

Dashboard Overview

Your at-a-glance command centre. Key metrics (including CapEx, monthly profit, working capital, and payback period) update live as you adjust global parameters.

Currently viewing ↓
Capital Planning

CapEx & Working Capital

Model your one-time setup budget and recurring monthly costs (including equipment, interiors, rent, and supplies) across fixed and variable asset classes.

Open module →
Revenue

Sales & Margins

Set daily transaction targets, average order value, and expected margins. Instantly see your revenue ceiling plotted against real operational capacity.

Open module →
Financial Health

Returns & Growth

Calculate your break-even threshold in monthly sales, daily transactions, and days, featuring live sensitivity as you adjust investment and margin inputs.

Open module →
Partnership

Operations & Split

Allocate profit shares between co-founders and model the net impact of delivery aggregator commissions on your blended post-commission margin.

Open module →
Query Engine

Dynamic Query Matrix

Answer 16 structured investment questions with live parameter sliders, starting from ideal cost breakdown to required sales for a target income, all in one interactive engine.

Open module →

Beginner Hub (Live)

Adjust parameters globally to recalculate the entire business model.

Financial Performance Dashboard

Live, interactive dashboard summarizing your setup CapEx, working capital margins, and payback periods.

One-Time Capex
₹16,50,000
Expected Monthly Profit
₹5,00,000
Monthly Working Capital
₹5,10,000
Payback Period
5.0 Months
Add Custom Parameter

Monitor and adjust any baseline tuner directly in this grid.

80 / 100
GRADE A+ • EXCELLENT
COMPOSITE STRATEGIC INDEX

Investment Attractiveness & Viability Score

Multi-variable weighted algorithmic synthesis evaluating unit economics, payback speed, capacity throughput, and cash runway resilience.

Investment Allocation Ratio

Hover over slices or legend items to inspect granular capital allocations.

Total Capital ₹25,00,000 Live Model Allocation

Operational Baseline Parameters

Adjust operational tuners live to see instant allocation and runway impact.

Operating Days 26 days / month
Operating Hours 10 hours / day
Average Order Value (AOV) ₹150
Avg Order Service duration (AOSd) 8 minutes
City Tier Target Tier 2 (Baseline)

💡 Smart Runway Insight

Your current monthly operational costs are ₹5,10,000. To remain sustainable, ensure your cash runway supports at least 3 months of operations (₹15,30,000) before generating positive cash flow.

🔄 Coordinated Diagnostics & Operational Advisor

🟢 Balanced Model

Live checks analyzing critical relationships between setup capital, staffing, capacity, pricing, and operating runway.

📈 5-Year Pro-Forma DCF & Margin Waterfall

Discounted Cash Flow (10% Hurdle Rate), YoY revenue compounding, and operational EBITDA conversion.

INSTITUTIONAL GRADE

5-Year Cumulative Cash Flow Projection

Year 1₹(8,50,000)
Year 2 (Break-Even)₹3,20,000
Year 3₹15,80,000
Year 4₹29,40,000
Year 5₹44,20,000

Annual Revenue to EBITDA Waterfall

Gross Revenue (100%) ₹96,00,000
- Cost of Goods Sold (COGS) -₹23,04,000
= Gross Profit ₹72,96,000 (76%)
- Operating Expenses (OpEx) -₹48,00,000
= Net Operating EBITDA ₹24,96,000 (26%)

🎯 2D Sensitivity Heatmap (Volume vs. Ticket Yield)

Cross-tabulation showing annual EBITDA and payback speed under varying footfall and pricing shifts.

Positive Yield Deficit
Footfall \ Ticket -15% Ticket -7.5% Ticket Base Ticket +7.5% Ticket +15% Ticket
-20% Covers ₹11.2L 22m ₹13.4L 19m ₹15.8L 16m ₹18.2L 14m ₹20.6L 12m
-10% Covers ₹14.5L 18m ₹17.1L 15m ₹19.8L 13m ₹22.4L 11m ₹25.1L 10m
Base Covers ₹18.0L 14m ₹20.8L 12m ₹24.0L 10.4m ₹26.8L 9m ₹29.6L 8m
+10% Covers ₹21.4L 12m ₹24.5L 10m ₹27.8L 9m ₹31.1L 8m ₹34.4L 7m
+20% Covers ₹24.8L 10m ₹28.3L 9m ₹32.0L 8m ₹35.6L 7m ₹39.2L 6m
Guided Decision Engine VERIFIED BENCHMARKS

Novice Investor Playbook & Cafe Analyzer

An intuitive 4-step financial & operational stress-testing simulator. Designed for first-time cafe founders to validate startup budgets, daily sales targets, and kitchen capacity without financial jargon.

01
Step 1 Capital Allocation
02
Step 2 Revenue & Margin
03
Step 3 Kitchen Throughput
04
Step 4 AI Risk Diagnostic
01 Capital Sizing

Investment Breakdown & Spending Limits

Establish standard cafe cost structures and see optimal spending limits across 6 core development buckets.

What is your total available startup capital to launch the cafe?
Novice Investor Golden Rule: Never commit more than 60% of your total capital to physical fit-out and equipment. Always safeguard at least 20% to 25% (₹2,00,000+) as a liquid Working Capital cushion to survive the first 3 to 6 months of gestation.
02 Revenue & Margin

Bidirectional Profitability & Revenue Planner

Switch between goal-seeking (calculating sales needed for target profit) and forward forecasting (calculating profit from daily sales).

Operating Assumptions & Unit Economics Tuners Adjust active monthly operational days and target profit margin %
26 Days
20%
How much monthly take-home net profit do you want to generate?
Required Daily Sales ₹19,231 Assuming 26 active operational days/mo
Required Monthly Revenue ₹5,00,000 At 20.0% net profit margin
Estimated Food Cost (COGS) ₹1,60,000 32% benchmark raw material cost
Operating Overhead Allowance ₹2,40,000 Rent + Salaries + Utilities + Misc
How much revenue do you realistically expect to make each day?
Projected Monthly Net Profit ₹1,30,000 Clean pocket take-home surplus
Projected Net Margin 20.0% Healthy F&B standard margin
Monthly Gross Revenue ₹6,50,000 ₹25,000/day × 26 operational days
Total Monthly Expenses ₹5,20,000 COGS (₹2,08,000) + Fixed OpEx (₹3,12,000)
03 Kitchen Throughput

Physical Kitchen Capacity & Order Volume Gauge

Ground your financial targets in physical reality by measuring preparation speed, daily order counts, and kitchen bottleneck limits.

Operating Setup & Service Velocity
₹150
10 Hours
6 Mins
2 Stations
Real-Time Kitchen Load & Bottleneck Meter
Daily Orders Needed 133 Bills needed at ₹150 AOV
Physical Kitchen Ceiling 200 Max orders kitchen can produce
Kitchen Capacity Utilization: 66.5% (Optimal Pace)
Physically Feasible: Your target of 133 orders/day is well within your kitchen's maximum capacity of 200 orders/day. Your kitchen will run smoothly without chaotic rush-hour bottlenecks.
AOV Power Insight: The "Combo & Upsell" Multiplier

See how increasing customer spend per visit significantly relieves kitchen rush-hour pressure:

-32% Less Kitchen Strain
Current AOV (₹150): 133 Orders / Day
If AOV boosted +35% (₹203): 98 Orders / Day
04 Risk Diagnostic Matrix

AI Business Possibility & Feasibility Scorecard

Comprehensive multi-dimensional evaluation of your capital, revenue targets, workload, and liquid survival runway.

88 / 100

Highly Feasible & Operationally Balanced

Your capital allocation, daily sales expectations, and kitchen throughput are well harmonized for sustainable profitability.

HIGH POSSIBILITY (REALISTIC & BALANCED)
1. Capital-to-Sales Fit 100%

0.5× turnover: Budget comfortably supports kitchen assets.

2. Kitchen Throughput 85%

66% utilization: Comfortable pace during peak rushes.

3. Customer Footfall Burden 90%

13 bills/hr: Very manageable customer inflow pace.

4. Runway & Cash Buffer 95%

₹2.0L runway protects against initial gestation slumps.

Why This Model Works (Validated Strengths)
Risk Drivers & Bottlenecks (Actionable Friction Points)

Establishment & Runway Analyzer

Validated Budget

Model your complete pre-opening setup expenses (One-Time CapEx) and calculate your liquid survival runway. All edits are dynamically locked and protected.

⚠️
Budget Variance Detected

Calculated startup capital differs from your target investment baseline.

Itemized Variance Origin Breakdown
Comparing current line-item allocations against baseline:
Operating Cash Runway Buffer: 3 Months
Mo
City Tier Calibration:
Upfront Fixed CapEx 56% of Startup
₹14,00,000
Machinery, Fit-out, Advance & Setup
Monthly OpEx Burn Rate ₹3.8L / mo
₹3,80,000
Fixed + Variable + Occasional per month
Runway Reserve Required 3 Months Buffer
₹11,40,000
₹3,80,000 × 3 Months Survival Buffer
Total Startup Capital 100% Fund Pool
₹25,40,000
CapEx + Full Runway Cushion

Capital Allocation & Runway Split

Live Breakdown
Startup Pool ₹25.0 L Setup + Runway

One-Time Fixed Assets (CapEx)

56% of Total
Category Allocation (%) Amount (₹) Lock
Total Upfront CapEx 56.0% ₹14,00,000

Monthly Working Capital & Runway

44% of Total
Category Type Monthly (₹) Runway Total Lock
Total OpEx & Runway ₹3,80,000/mo ₹11,40,000

Cafe Sales & COGS Analyzer

Simulate transaction capacities, check bottleneck constraints based on order processing speeds, and optimize margin profiles.

Transaction & Capacity Tuner

Peak Velocity Engine

Calibrate operating cadence, station throughput, and order turnaround dynamics to stress-test maximum volume ceilings.

10 hrs
📅
26 days
₹150
⏱️
8 mins
👥
Maximum Theoretical Capacity Limits
Orders/Hour/Station 8 Peak velocity per lane
Max Daily Sales ₹45,000 Peak 24h gross potential
Max Monthly Sales ₹11,70,000 Top-line throughput ceiling
🧭 Turnaround Cadence & Operating Benchmarks
Specialty Brew (8m)
Operating Pace Artisanal Specialty Pace
Hourly / Station 7.5 orders/hr
Total Station Ceiling 30 orders/hr

Faster turnaround velocity shortens queues during peak rush hours, expanding hourly order capacity without increasing floor lease overhead.

💡
Throughput Optimization & Bottleneck Strategy
⚡ Peak Velocity Optimal

Every 1-minute reduction in AOSd expands station throughput by +14.3%, unlocking an estimated ₹1,67,143 / month in untapped gross capacity without expanding store size or physical footprint.

Quick Levers:

Cost of Goods Sold (COGS) & Revenue Split

100% Reconciled

Unified unit economics waterfall. 100% of sales is partitioned across direct ingredients, packaging, operating overhead, and retained margin.

Revenue Distribution Waterfall Total: ₹8,00,000 / mo (100.0%)
Food: 28.0%
Pack: 6.0%
Overhead: 46.0%
Margin: 20.0%
💡 Hover or focus on any segment or card to inspect its mathematical methodology and optimization levers.
Food Cost (Direct Ingredients) Raw ingredients & kitchen supplies
28.0% of Sales
₹2,24,000 / mo
Coffee beans, specialty dairy, syrups, food preps & bakery goods
📦
Packaging & Disposables Takeaway & serving supplies
6.0% of Sales
₹48,000 / mo
Eco cups, sip lids, thermal sleeves, kraft bags & compostable cutlery
🏢
Operating Overheads & OpEx Lease, payroll, utilities & ads
46.0% Ceiling (Budget OK)
₹3,68,000 / mo
Store rental lease, barista payroll, 3-phase power, POS software & PR
💰
Net Profit Margin (EBITDA) Retained pocket profit
20.0% of Sales
₹1,60,000 / mo
Net pre-tax cash earnings retained by founder / business partners
📐 Mathematical Reconciliation & Formula Methodology
= + + +
Prime Cost (Food + Pack) 34.0% Healthy < 55%
Operating Overhead 46.0% Balanced
Net Take-Home Retained 20.0% Target Retained

All cost components represent direct shares of gross monthly revenue and recalculate in real-time with an exact 100% mathematical balance.

💡
AOV Optimization Strategy & Revenue Upside
Current AOV: ₹150
Target Simulated AOV ₹180 +₹30 / ticket
Monthly Revenue Injection +₹1,60,000 / mo Pure top-line expansion
Annualized Revenue Upside +₹19,20,000 / yr Zero additional rent/labor

Increasing your Average Order Value directly expands your gross profit pool without requiring additional store square footage or extra barista labor.

ROI & Break-even Analyzer

Evaluate exact capital payback curves, operational break-even thresholds, fixed vs. variable cost anatomy, and interactive scenario stress testing.

Monthly Break-Even
₹3,55,263
44.4% of Target Revenue
Daily Break-Even Volume
38 Customers / day
~3.1 Orders / Hour (12h Day)
Margin of Safety
+52.2%
Strong buffer against demand drops
Capital Payback Period
15.6 Months
Est. Target: Oct 2027
Annualized Net ROI
+₹12,40,000
+38.5% Net 1-Yr ROI

Interactive Stress-Test Sandbox Dynamic Simulation

Simulate footfall fluctuations and operational inflation to stress-test your break-even buffer in real time.

Customer Demand / Footfall Variance 0% (Baseline)
-30% (Severe Slump) ₹8,00,000 / mo +30% (Peak Boom)
Operational & Material Inflation Variance 0% (Baseline)
-20% (Max Efficiency) ₹4,80,000 / mo +30% (Severe Shock)

Profitability Timeline & Payback Curve

Break-Even @ Month 14.2
Capital Recovery Deficit Break-Even Crossing Net Profit Surplus

Cost-Volume-Profit (CVP) Crossover

Operating Profit Zone
Fixed Overheads Total Cost Curve Total Revenue Line

Fixed vs. Variable Cost Structure

Fixed: 44.8%
Variable: 55.2%
Monthly Fixed Overhead (Rent, Core Staff, Utilities, Software) ₹1,95,000
Monthly Variable COGS (Coffee Beans, Milk, Food, Packaging) ₹2,40,000
Occasional & Contingency Reserves (Maintenance, Buffers) ₹75,000
Contribution Margin Ratio (CMR) 68.5%

Founder's Everyday Operational Benchmarks

Time-of-Day Break-Even Clock 🎯 2:15 PM Daily
Required Hourly Order Velocity 7.6 Orders / Hour
Net Cash Generated Per Customer Beyond Hurdle +₹112 / Order
5-Year Cumulative Net Profit Projection +₹68,40,000
💡 Operational Rule of Thumb: Once daily gross sales cross your break-even threshold (approx. ₹13,660/day), roughly 68.5% of every additional rupee goes straight into bottom-line profit.

Business & Growth Metrics

Evaluate subscription-style recurring baseline models, cash burn rates, customer lifetime value (LTV), acquisition cost (CAC), and granular unit economics.

MRR (Monthly Recurring)
₹6,50,000
Based on Repeat Customer Rate
ARR (Annualized Recurring)
₹78,00,000
MRR annualized (12 Months)
Gross Profit
₹8,95,000
89.5% Gross Margin
Net Revenue (Post-Comm)
₹9,28,000
After aggregator commissions
Net Profit
₹4,28,000
42.8% Net Margin
Monthly Cash Burn
₹5,82,000
Gross outflow per month
Cash Runway
Infinite
Cash-flow positive

Acquisition & Retention Tuners

Adjust values to dynamically compute Customer Acquisition Cost (CAC) and Lifetime Value (LTV).

Repeat Customer Rate (%) 65%
Loyal Visits / Month 4 visits
Customer Lifespan (Months) 12 months
Marketing & Ad Budget ₹75,000
New Customers Acquired / Mo 2,333
Customer Acquisition Cost (CAC) ₹32
Customer Lifetime Value (LTV) ₹6,444

Unit Economics & Per-Order Profitability

Interactive per-ticket model. Adjust average ticket price, COGS %, or aggregator commission to evaluate contribution margin and customer lifetime value.

₹150
34.0%
9.4%
Average Order Value (AOV Ticket) ₹150
COGS per Order (Food & Packaging) ₹51.00 (34.0%)
Aggregator Commission per Order ₹14.10 (9.4%)
Contribution Margin per Order ₹84.90 (56.6%)
LTV to CAC Health Ratio

Your LTV to CAC ratio is 201x. A ratio greater than 3x indicates highly efficient customer acquisition economics.

🟢 Healthy

Operations, Staffing & Multi-Partner Manager

Evaluate staffing productivity metrics, model Swiggy/Zomato delivery aggregator margin impacts, and structure multi-partner equity dividends, working salaries, and franchise royalty payouts.

Labor Productivity & Staffing Plan

Headcount, loaded payroll budget, and per-employee revenue output.

🟢 Healthy (13.1%)
Total Monthly Payroll Budget ₹1,05,000
Sales Generated per Staff ₹1,60,000 / mo
Labor Cost as % of Revenue 13.1%
Shift Coverage & Station Buffer Optimal (4-6 FTE)
💡 Payroll Optimization Strategy

Maintain base salary at 80% with 20% volume incentive tied to ticket fulfillment speed. Industry benchmark: keep labor cost between 18%–26% of gross monthly sales.

Revenue Share & Delivery Aggregator Split

Swiggy/Zomato channel commission vs. high-margin in-store walk-in sales.

18%
40%
In-Store Walk-in Sales (High Margin) ₹4,80,000
Online Delivery Channel Sales ₹3,20,000
Aggregator Commission Paid (Monthly) ₹57,600
Annual Aggregator Commission Leakage ₹6,91,200 / yr
Blended Net Profit (Post-Commission) ₹1,02,400 / mo (12.8%)

Multi-Partner Equity, Investment & Dividend Waterfall Studio

Model dynamic equity ownership, bidirectional capital contributions vs. equity %, operating management salaries, and monthly dividend distributions for 2 to 5+ partners.

0.0%
Net Monthly Profit Pool ₹1,60,000 / mo
Equity Allocation Status ✅ 100.0% Allocated

Conceptual & Functional Query Matrix

Click any question below to see its dynamic mathematical resolution, formula structure, and strategic advisory notes based on your current inputs.

💡

Select a Question

Select any of the 16 mandatory questions on the left to activate the dynamic calculator and view its full strategic analysis.

Calculated Reports & Exports

Configure, select, and export your cafe investment parameters, tables, charts, and metric calculations in professional CSV, Excel (XLSX), or PDF formats.

1. Select Report Content

Choose the components you want to include in the exported report:

2. Select Export Format

Run calculations and trigger direct file downloads:

Capital Budget: ₹25,00,000
Monthly Profit Goal: ₹5,00,000
Calculated Payback: 5.0 Months
⚖️
Important Financial & Simulation Disclaimer:

All models, ROI calculations, unit economics, and stress-test scenarios generated by this platform are strictly for educational, simulation, and preliminary exploratory purposes. They do not constitute formal tax, legal, or certified investment advice. Hospitality ventures carry operational, market, and leasehold risks. Users are strongly recommended to consult a qualified Chartered Accountant (CA), certified financial advisor, or legal counsel before signing leases or deploying capital.

Master Financial & Operational Knowledge Base 50 Parameters Documented

Terminology & Operational Glossary

Explore rigorous mathematical definitions, strategic business impact analyses, and simplified real-world operating scenarios for every financial, operational, and unit economic metric in the platform.

Knowledge Base & Masterclass Library 31 Comprehensive Articles & Case Studies

Guides & Blogs

Explore interactive tab tutorials, real-world Indian founder case studies, strategic risk playbooks, and exit valuation masterclasses.

Dashboard Overview Interactive Demo
3-Step Demo

Dashboard Overview

Master the financial cockpit, adjust baseline inputs, and monitor live advisor alerts.

CapEx & Working Capital Capital Buffer
3-Step Demo

CapEx & Working Capital

Master the 60/40 capital rule, contractor overrides, and 3-month cash runway security.

Sales & Margins Throughput Limit
3-Step Demo

Sales & Margins

Tune active registers, order prep duration (AOSd), and check physical revenue limits.

Returns & Growth Payback ROI
3-Step Demo

Returns & Growth

Track cumulative cash recovery timelines and evaluate monthly break-even sales volume.

Business & Growth Unit Economics
3-Step Demo

Business & Growth

Measure Customer Acquisition Cost (CAC), Lifetime Value (LTV), and LTV:CAC ratios.

Operations & Split Delivery Channels
3-Step Demo

Operations & Split

Simulate Swiggy/Zomato commission erosion and manage co-founder equity profit splits.

Dynamic Query Matrix 16 Q&A Solved
3-Step Demo

Dynamic Query Matrix

Resolve 16 financial queries, adjust variable X inputs, and inspect instant answers.

Export Reports PDF & Excel Packages
3-Step Demo

Export Reports

Package multi-tab reports and export institutional PDF, Excel, or CSV files.

Terminology & Glossary Formula Reference
3-Step Demo

Terminology & Glossary

Search financial definitions, LaTeX equations, and strategic business impact notes.

Tier Comparison Guide Tier Comparison
6 min read

Tier Comparison Guide

Beginner vs. Adaptive vs. Professional: choosing the right simulation depth.

Beginner Playbook Beginner Tier
5 min read

Beginner Mode Playbook

The 4-step zero-jargon feasibility roadmap for first-time cafe entrepreneurs.

Adaptive Mode Adaptive Tier
7 min read

Adaptive Mode Deep-Dive

Recipe COGS, table turnover calibration, and 3-scenario stress testing.

Professional Mode Professional Tier
8 min read

Professional Mode Deep-Dive

Aggregator delivery splits, partner equity waterfalls, and PDF pitch decks.

Master System Map System Architecture
5 min read

Feature Guide

Computational engine architecture and calculation pipeline overview.

Strategic Use Cases Strategy Scenarios
6 min read

Strategic Use Cases

4 crucial scenarios where this calculator protects capital and proves models.

Key Financial Insights Deep Metrics
5 min read

Key Financial Insights

4 surprise metrics that predict cafe success or failure before opening.

Target Audience Target Profiles
4 min read

Target Audience

Who this tool is built for: Founders, operators, investors, and landlords.

Best Users Operator Blueprints
5 min read

Best Users

3 operator blueprints: Kiosk, lounge bar, and regional franchise networks.

What You Miss Pitfall Defense
5 min read

What You Miss

Avoiding hidden pitfalls: Runway traps, capacity limits, and delivery erosion.

Scope & Significance Variable Scopes
4 min read

Scope & Significance

Executive, operational, structural, and growth levers breakdown.

Export Guide Fundraising Packages
4 min read

Export Guide

Packaging investor proposals and banker-ready PDF/Excel deliverables.

Tool Philosophy Simulator Vision
4 min read

Tool Philosophy

Why dynamic active simulation beats rigid static spreadsheets.

Rahul's Story Beginner Workflow
6 min story

Rahul's Story

₹10L Campus Chai Corner in Pune: Bootstrapping a lean startup model.

Priya's Story Professional Workflow
7 min story

Priya's Story

₹25L Koramangala Specialty Lounge: Balancing high rent with premium AOV.

Karan's Story Strategic Workflow
8 min story

Karan's Story

₹40L Mumbai Hybrid & Swiggy: Optimizing online delivery commissions.

Arjun's Story Franchise Workflow
9 min story

Arjun's Story

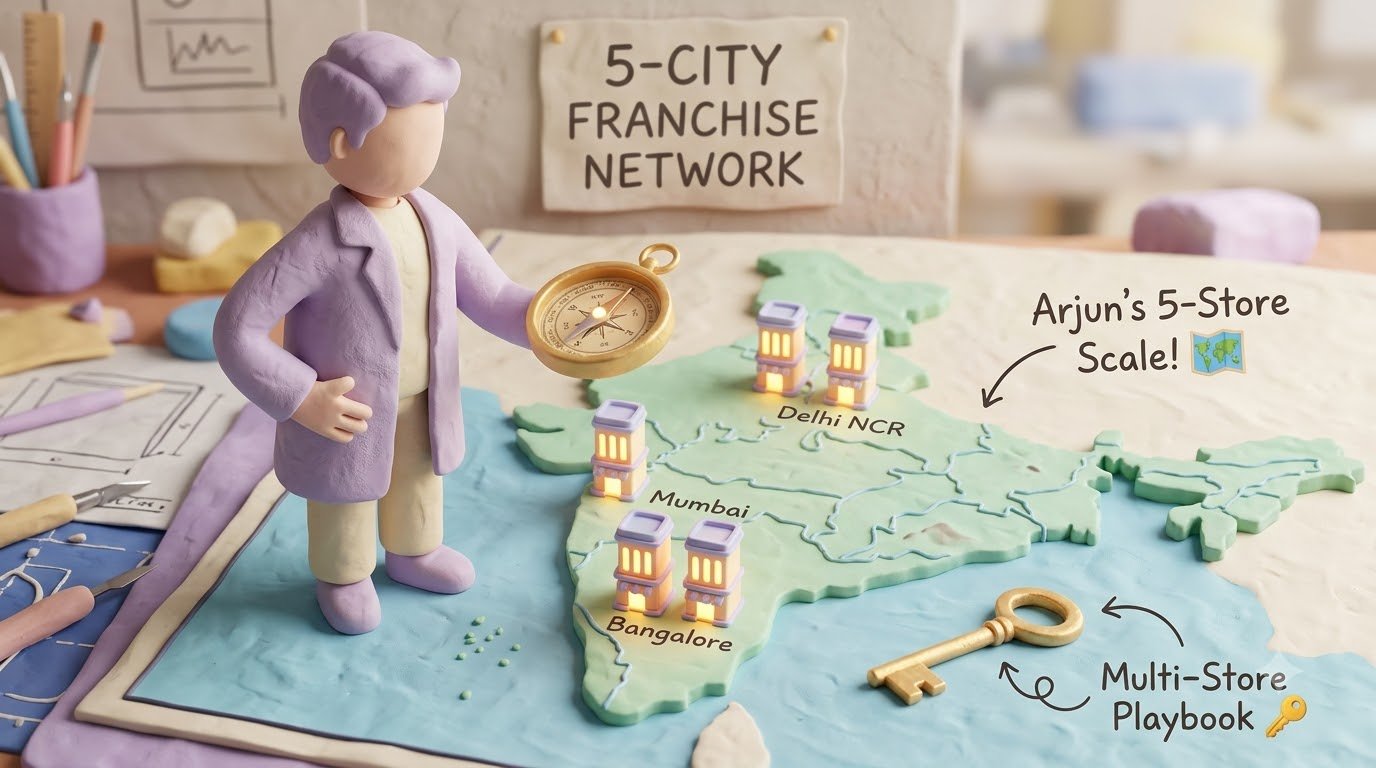
5-City Regional Expansion: Standardizing unit economics across multi-stores.

Ananya's Story Academic Workflow
8 min story

Ananya's Story

F&B MBA Capstone Masterclass: Auditing financial models for thesis defense.

Peak-Hour Surge Surge Throughput
6 min masterclass

Peak-Hour Surge

Menu engineering & prep duration tuning to double morning rush revenue.

Inflation Playbook Supply Chain Defense
7 min masterclass

Inflation Playbook

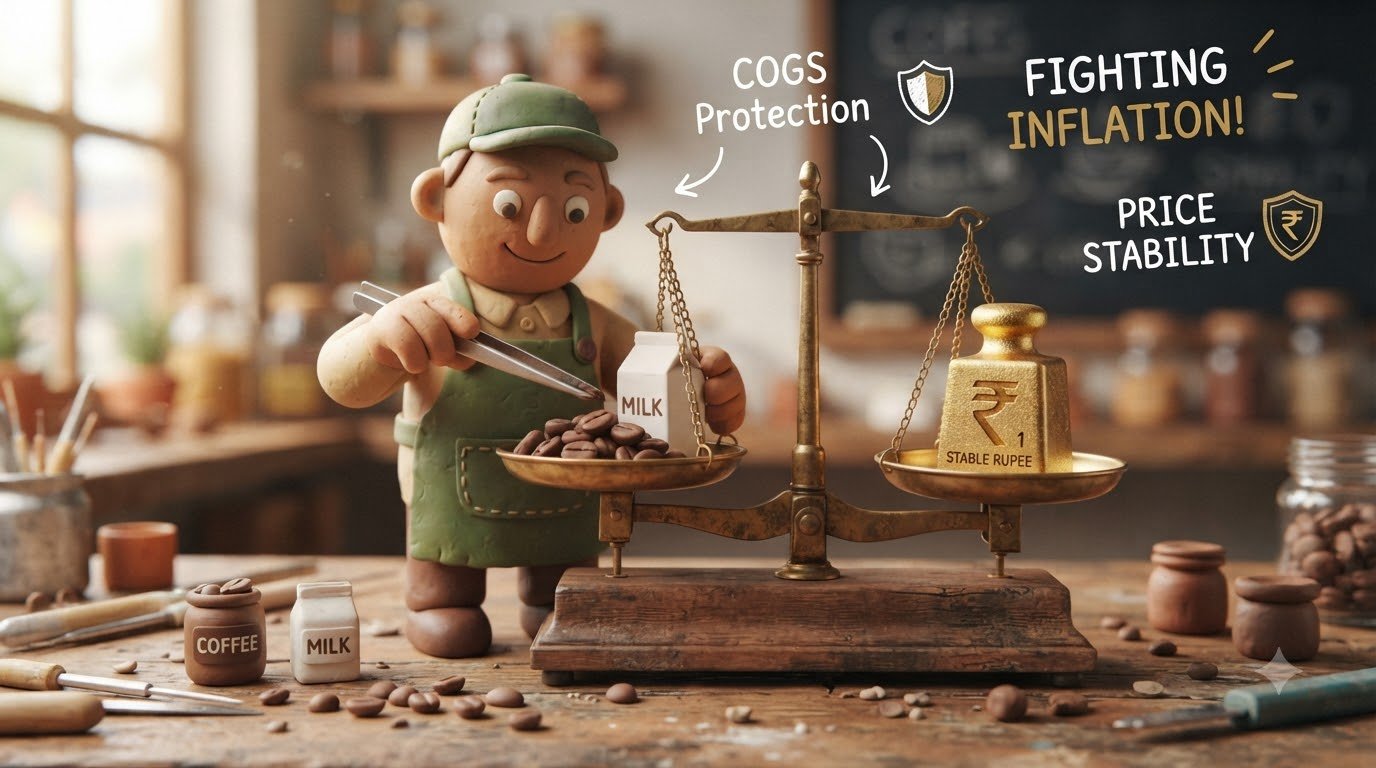
Supply chain stress-testing & portion control to absorb ingredient spikes.

Exit & Valuation M&A Buyout
8 min masterclass

Exit & Valuation

Building for a 4x–8x EBITDA valuation multiplier and packaging M&A data rooms.

Master Platform Strategy Guide Master Strategy Guide
Full Platform Deep-Dive · 15 min read

The Master 9-Tab Strategy Guide

An executive walkthrough connecting every calculator, ratio, and advisor alert on this platform into an actionable decision-making roadmap.

First-Time Tech Founder First-Time Entrepreneur
Bangalore Kiosk · 12 min read

Case Study 1: The First-Time Tech Founder

How a tech worker deployed ₹18 Lakhs into an HSR Layout kiosk, tuned zero-staff modeling, and locked a 14.2-month payback.

Multi-Unit Operator Expansion Existing Business Owner
Pune Expansion · 14 min read

Case Study 2: The Multi-Unit Restaurant Operator

Evaluating a ₹28 Lakh express coffee vertical in Pune with Tier 2 cost multipliers, shared commissary prep, and 3-station throughput.

Turnaround of Bleeding Cafe Struggling Turnaround
Mumbai Turnaround · 14 min read

Case Study 3: Overhauling a Bleeding Outlet

Diagnosing negative margins (-8%) in a Bandra cafe, breaking the 62% aggregator trap, and returning to +18% net profitability.

Corporate Switcher & NRI Investor Industry Switcher & NRI
Hyderabad Flagship · 16 min read

Case Study 4: The Corporate Switcher & NRI Investor

Deploying ₹50 Lakhs into a Jubilee Hills flagship, structuring 60:40 partner equity, and stress-testing worst-case downturns.

Dashboard Overview: Your Real-Time Financial Control Center

Learn how the centralized control bar keeps your entire cafe business model synchronized, and see how live advisor alerts protect your cash before you sign a commercial lease.

Global Control Bar

Global State

Adjust your total starting capital, monthly revenue target, baseline profit margin, and location rent in one central place.

Live Recalculation

Instant Sync

Every single change ripples across all 9 subsequent modules in milliseconds, recalculating break-even points, runway months, and partner payouts.

Coordinated Advisor

Health Guardrails

Fourteen automated sanity checks constantly monitor your numbers, flashing green when healthy and amber or red if rent or setup costs get too dangerous.

1. Why Centralized Modeling Matters

Running an F&B business without a connected financial model is like driving in heavy fog with broken gauges. In traditional spreadsheets, changing rent or customer ticket size means manually hunting through multiple sheets, which easily causes broken formulas and hidden financial traps.

In Café Investment Analyzer, the Dashboard functions as your live control center. Change one slider in the top bar, and the simulator updates your startup budget, equipment limits, customer repeat value, and safety reserves across the entire platform.

🏢 Real-World Scenario: The Rent vs. Revenue Stress Test

Imagine you are evaluating a prime 600 sq ft corner space in Indiranagar, Bangalore with a quoted monthly rent of ₹95,000. When you enter ₹95,000 rent against a projected ₹6,00,000 monthly sales target, the Coordinated Advisor immediately flags that rent consumes 15.8% of your revenue. This warns you that you must either negotiate rent down to ₹80,000 or expand breakfast daypart sales to reach ₹7,50,000 per month to maintain a safe occupancy cost ratio.

✓ Rule of Thumb: Keep occupancy costs (rent plus property maintenance) strictly under 15% of gross monthly sales.

2. The Three Vital Health Checks on Your Dashboard

Metric & Target Standard

Capital Payback Horizon: Target full capital recovery within 10 to 14 months of steady operations.

Liquid Cash Runway: Maintain at least 3.5 to 6.0 months of operating cash reserve in the bank.

Prime Cost Ratio: Keep the combined sum of food ingredients and staff wages strictly below 55% of total sales.

Why It Protects Your Venture

Short payback periods reduce exposure to market shifts and make it much easier to raise expansion capital.

A healthy runway protects your staff and supplier payments during quiet monsoon months or unexpected road repair closures.

Keeping prime costs under 55% guarantees enough gross profit margin to easily pay rent, utilities, and partner dividends.

3. Step-by-Step Action Guide

  • Step 1: Enter Total Starting Fund: Type your total available startup capital into the Full Investment box in the top control bar. Watch your setup budget and cash runway partition automatically.
  • Step 2: Calibrate Revenue & Profit Targets: Enter your expected monthly sales and realistic net profit margin. Watch the payback timeline card update on the spot.
  • Step 3: Check the Advisor Panel: Review the Coordinated Advisor cards at the bottom of the dashboard. Resolve any red warnings before diving into detailed equipment or recipe adjustments.
Live UI Preview: Master Cockpit Summary Card Deck
Full Investment
₹25,00,000
Expected Sales
₹8,00,000/mo
Payback Horizon
9.7 Months 🟢
Cash Runway
4.2 Months 🟢

The global header drives synchronous mathematical calculations across all 10 modules simultaneously.

CapEx & Working Capital: Allocating Setup Cash and Securing Your Survival Buffer

Master the 60/40 capital rule, learn why strategic networking is human community capital rather than IT hardware, and structure mandatory Indian licenses for smooth annual operations.

One-Time Setup CapEx

60% of Fund

The non-recurring upfront cash required to build the kitchen, furnish the dining space, secure the lease, and acquire machinery before opening day.

Strategic Networking

Community Capital

Dedicated upfront funds for structured business networks (BNI, Rotary, Chamber of Commerce) and neighborhood launch mixers that build an instant corporate client base.

Working Capital Buffer

40% of Fund

Liquid cash held safely in the operating bank account to cover rent, utilities, and payroll during the initial 3 to 6 month customer discovery phase.

1. The Golden 60/40 Asset Allocation Rule

The number one mistake rookie cafe founders make is spending 80% to 90% of their total investment on interior aesthetics, designer light fixtures, and luxury Italian espresso machines. When the cafe opens and initial footfall takes a few weeks to build, they have zero cash left to pay the second month of rent and staff salaries.

The simulator enforces the battle-tested 60/40 rule: allocate approximately 60% of your total capital to physical setup and keep 40% in liquid bank reserves as an operational safety shield.

Real-World Scenario: Networking Capital in Action

Consider an entrepreneur opening a specialty coffee bar in Bandra West, Mumbai with a ₹25 Lakh budget. Instead of spending ₹50,000 on extra IT cables, they allocate ₹55,000 into strategic networking: securing an executive seat in a local BNI chapter and sponsoring a monthly business breakfast. Within the first 60 days, that single network generates 45 recurring weekly executive breakfast orders and 3 corporate gift-hamper contracts, adding ₹65,000 in monthly high-margin sales without spending a single rupee on paid Instagram ads.

✓ Key Principle: Treat Networking Capital as a proactive customer acquisition engine that drives predictable, high-ticket B2B catering orders.

2. Mandatory Statutory Licensing & Annual Renewals (India)

To prevent costly municipal shutdowns and fines, statutory permissions must be properly accounted for during setup and maintained through annual renewal funds:

Statutory License & Authority

FSSAI Food Safety License: Issued by Food Safety and Standards Authority of India (State or Central tier).

Municipal Health Trade License: Issued by the local city corporation (BBMP, BMC, MCD, GHMC).

Fire Department NOC: Issued by State Fire and Emergency Services following physical site inspection.

Shop & Commercial Establishment: Issued by the State Labor Department under commercial establishment acts.

Budgeting & Renewal Schedule

Budget ₹7,500 to ₹15,000 upfront. Plan ₹3,000 to ₹5,000 annually in your recurring renewal fund.

Budget ₹12,000 to ₹25,000 setup cost. Must be renewed every financial year before March 31st.

Budget ₹20,000 to ₹45,000 for commercial kitchen fire suppression and yearly extinguisher refilling.

Budget ₹3,000 to ₹8,000 for entity labor registration and periodic state e-portal compliance updates.

3. Step-by-Step Action Guide

  • Step 1: Review Baseline Allocations: Inspect the One-Time Setup table to see pre-populated industry estimates for machinery, interior civil works, and lease deposits.
  • Step 2: Enter Vendor Quotes: Type your actual contractor quotes and equipment invoices directly into the Override cells to customize your setup budget.
  • Step 3: Calibrate Strategic Networking: Enter your planned business network induction fees (BNI, Rotary, local merchant associations) in Row 5.
  • Step 4: Verify Runway Months: Check the Working Capital Runway box at the top. Ensure your liquid buffer provides at least 3.5 months of operational survival.
Live UI Preview: CapEx vs. Working Capital Runway Allocation
One-Time CapEx Setup
₹15,50,000 (62%)
Strategic Networking
₹55,000 (BNI/Rotary)
Liquid Working Capital
₹9,50,000 (38% · 4.2 Mo)

Maintaining at least 35% as liquid cash runway protects your venture during the opening gestation period.

Sales & Margins: Kitchen Throughput, Prep Speed, and Physical Revenue Limits

Discover why kitchen speed dictates your true revenue ceiling, configure active cashier stations, and verify that your kitchen can physically produce your sales targets without peak-hour walkouts.

Prep Speed (AOSd)

Speed Engine

Average Order Service Duration: the exact minutes required for your barista and kitchen team to assemble, plate, and serve a completed order ticket.

Active Stations

Counter Physics

The number of simultaneous POS billing registers and dedicated barista espresso stations operating during morning and evening rush hours.

Capacity Utilization

Health Benchmark

The percentage of your maximum kitchen capacity required to hit your sales target. An optimal range is 40% to 75% to prevent queue walkouts.

1. The Physical Bottleneck: Why Sales Projections Fail

One of the most frequent traps in cafe planning is projecting ambitious revenue numbers without checking the physical limits of the kitchen. A founder might project ₹12 Lakh per month in sales, but if the counter layout only has a single POS terminal and drinks take 4.5 minutes to prepare, the cafe will physically choke during the 8:30 AM to 11:00 AM rush hour.

Tab 3 connects your register count, preparation duration, and operating hours to calculate your true maximum revenue limit in rupees.

Real-World Scenario: The Morning Rush Bottleneck

Imagine a specialty coffee kiosk in Cyber City, Gurgaon. Operating 1 register with a 4-minute average ticket time allows a maximum of 15 orders per hour. Over a busy 3-hour morning window, the kiosk can serve at most 45 customers. At ₹250 average order value, peak morning revenue is physically capped at ₹11,250. By adding a pre-batch cold brew tap and a dedicated secondary payment tablet, average order time drops to 2.5 minutes, boosting morning throughput to 72 orders and generating an extra ₹6,750 every morning.

✓ Key Principle: Shaving 60 seconds off average prep time directly expands your peak-hour revenue ceiling without increasing rent.

2. Step-by-Step Action Guide

  • Step 1: Set Active Service Stations: Adjust the Active Stations slider (1 to 4 stations) to match your physical POS counter and espresso machine group heads.
  • Step 2: Calibrate Prep Speed: Slide Average Order Service Duration (AOSd) to reflect your menu complexity (e.g., 3.0 to 4.0 minutes for espresso bars).
  • Step 3: Check Maximum Monthly Ceiling: Verify that your calculated maximum monthly sales limit exceeds your global target sales by at least 35%.
Live UI Preview: Kitchen Throughput & Capacity Validation
Active Registers
2 Stations
Avg Prep Time (AOSd)
3.5 Minutes
Utilization Health
42.5% (Optimal 🟢)

A 42.5% utilization rate provides an optimal operational buffer during rush-hour peaks.

Returns & Growth: Payback Timelines, Daily Break-Even, and Capital Recovery

Track your cumulative cash recovery curve, set target payback milestones, calculate daily break-even customer counts, and verify your safety margin before launch.

Payback Horizon

10-14 Month Target

The exact number of operating months required for cumulative net cash flow to fully recover your initial setup investment.

Daily Break-Even

Daily Hurdle

The minimum number of paid customer receipts your cash register must print every single day to pay that day's share of fixed rent, wages, and utilities.

Margin of Safety

≥ 35% Buffer

The percentage by which monthly revenue can fall before the business reaches zero profit and begins losing operating cash.

1. The Daily Solvency Hurdle

In food service, profit is a daily discipline. Every morning when you unlock your doors, your business operates at a deficit until the register rings the exact order that covers the day's portion of rent, barista salaries, electric power, and coffee bean costs.

Tab 4 gives you an exact daily order target so your store manager always knows the minimum daily volume required to keep the business profitable.

Real-World Scenario: Calculating the Daily Ticket Target

Consider a 40-seat cafe in Koregaon Park, Pune with ₹1,80,000 in monthly fixed rent, wages, and utilities. Operating at a 68% gross margin with a ₹250 average order value means each customer contributes ₹170 toward fixed costs. Dividing monthly fixed costs across 30.4 days reveals you need exactly 35 paying customers every day just to cover expenses. Once the register prints ticket number 36, every subsequent customer generates net distributable profit.

✓ Practical Target: If your location sees 500 pedestrians hourly, capturing just 35 daily customers requires a modest 0.7% walk-in conversion rate.

2. Step-by-Step Action Guide

  • Step 1: Set Target Payback Threshold: Set your target payback timeline (default: 12 months) based on investor expectations.
  • Step 2: Inspect the Cumulative Cash Curve: Review the interactive chart showing monthly cumulative net profit crossing the initial CapEx line.
  • Step 3: Check Daily Break-Even Orders: Compare your daily break-even order requirement against physical pedestrian traffic surveys outside your storefront.
Live UI Preview: Payback Period & Solvency Health
Projected Payback
10.4 Months 🟢
Daily Break-Even
34.8 Orders/Day
Margin of Safety
66.9% (Robust)

Full capital recovery is achieved well within the 12-month target window.

Business & Growth: Customer Repeat Economics, Loyalty Value, and Acquisition Efficiency

Apply modern retention economics to food service, calculate Customer Lifetime Value (LTV), evaluate marketing acquisition efficiency (CAC), and build predictable recurring revenue.

Lifetime Value (LTV)

Total Profit/Guest

The total cumulative gross profit a single loyal customer generates for your cafe across their entire multi-month relationship.

Acquisition Cost (CAC)

Acquisition Spend

The blended marketing and promotional cost to bring in one new first-time customer through social ads, tasting mixers, or influencer partnerships.

LTV to CAC Multiplier

≥ 3.0x Benchmark

The return on your customer acquisition spend. A ratio above 3.0x proves that marketing generates strong, profitable long-term compounding.

1. The Shift from Footfall to Customer Retention

Modern specialty cafes in urban business hubs do not survive on one-time tourist footfall. They thrive on the compounding economics of weekly regulars. When a nearby tech professional or corporate manager visits your cafe 3 times every week for their morning cappuccino and work meeting, they become a high-value recurring customer.

Tab 5 models this retention dynamic, showing how small improvements in hospitality and loyalty programs multiply the long-term value of your brand.

Real-World Scenario: The Value of a Loyal Regular

Suppose you spend ₹850 in blended local marketing to acquire a new patron for your HSR Layout, Bangalore outlet. If that customer visits 3.5 times per month with a ₹280 average ticket (generating ₹190 in gross profit per visit) and remains a regular for 10 months, their total Lifetime Value is ₹6,650. Your return on marketing spend is 7.8 times your acquisition cost, proving high unit profitability.

✓ Strategic Rule: Spending ₹850 to acquire a customer who generates ₹6,650 in gross profit is the most reliable way to scale an F&B brand.

2. Step-by-Step Action Guide

  • Step 1: Enter Customer Visit Frequency: Adjust Visits per Month (e.g., 3.5 visits) and Customer Lifespan (e.g., 10 months).
  • Step 2: Enter Blended Acquisition Cost: Input your estimated cost per new customer (e.g., ₹850) combining digital promotions and local events.
  • Step 3: Verify the LTV:CAC Ratio Card: Ensure your ratio displays at or above 3.0x to confirm your marketing budget is working efficiently.
Live UI Preview: LTV to CAC Multiplier Output
Customer LTV
₹6,664
Blended CAC
₹850
LTV : CAC Health
7.84x (Elite Tier 🟢)

An LTV:CAC ratio of 7.84x demonstrates superior unit economics and brand loyalty.

Operations & Split: Managing Delivery Platform Commissions and Structuring Partner Payouts

Understand how Swiggy and Zomato commission fees dilute gross profits, model disposable packaging costs, calculate blended margins, and automate monthly partner dividend distributions.

Aggregator Fee Drag

18-26% Commission

Third-party delivery platforms take a sizable cut on every order plus GST, which significantly reduces the cash that reaches your bank account.

Packaging Overhead

3-5% Cost Add

High-quality tamper-evident containers, bag seals, and insulated beverage carriers add extra recurring material expenses to each delivery order.

Partner Dividend Split

Equity Distribution

Automated rupee split calculator that divides monthly net profit between co-founders based on agreed equity ownership ratios.

1. The Delivery Margin Trap

In Indian metro cities, first-time cafe owners often celebrate hitting ₹10 Lakh in monthly sales, only to realize at month-end that they are operating at a net loss. The culprit is almost always unmodeled online delivery commission fees. When delivery represents 50% or more of total order volume, aggregator commissions (22% to 25%) combined with packaging costs (4%) can wipe out over half of your gross contribution margin.

Tab 6 simulates this multi-channel reality, calculating your true blended margin and automating monthly net dividend payouts for co-founders.

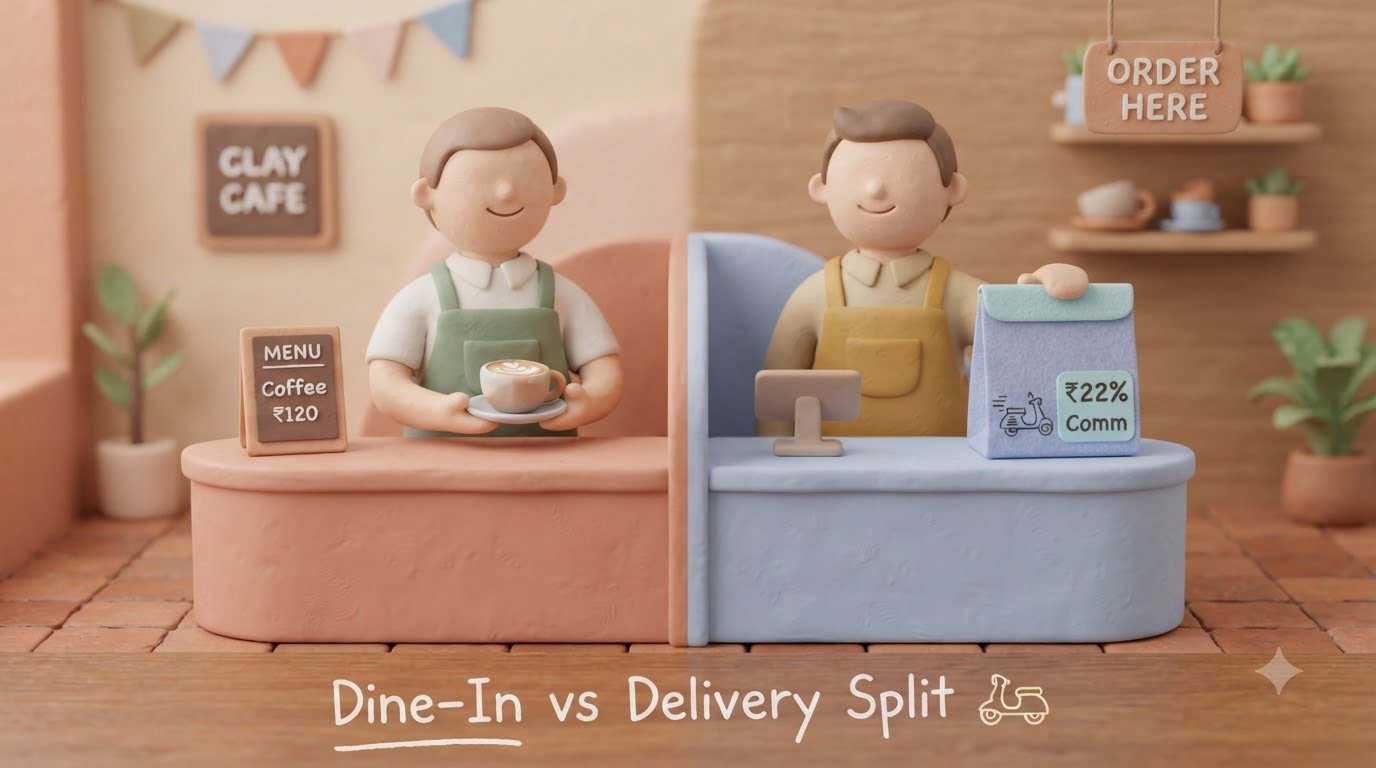
Real-World Scenario: Dine-In vs. Delivery Profitability

Imagine a cafe selling a gourmet sourdough sandwich for ₹300. When ordered for dine-in, raw ingredient costs are ₹90, leaving ₹210 in gross profit (70% margin). When the same sandwich is sold via Swiggy or Zomato with a 22% platform fee (₹66) and ₹12 in tamper-proof packaging, your gross profit drops from ₹210 down to ₹132 (44% margin). If 60% of your sales come through delivery apps without a 15% menu price markup, your total cafe profitability drops drastically.

✓ Strategic Rule: Apply a 12% to 15% price markup on online delivery menus or introduce delivery-exclusive meal bundles to protect your bottom line.

2. Step-by-Step Action Guide

  • Step 1: Set Online Channel Share: Adjust the Delivery Order Share slider (e.g., 40%) based on your location format.
  • Step 2: Calibrate Aggregator Take Rate: Input your negotiated commission fee in Aggregator Commission (e.g., 22%).
  • Step 3: Account for Packaging Overhead: Enter packaging material percentage (standard: 3.5% to 5.0%).
  • Step 4: Configure Partner Equity Split Slider: Drag the equity ratio bar (e.g., 60% Partner A / 40% Partner B) to inspect exact monthly rupee dividend payouts.
Live UI Preview: Delivery Erosion & Partner Dividends
Dine-In Margin
70.0%
Blended Gross Margin
59.6% (Diluted)
Partner A Share (60%)
₹96,000/mo
Partner B Share (40%)
₹64,000/mo

The blended margin engine exposes aggregator fee erosion and automates partner dividend splits.

Dynamic Query Matrix: Instant Answers to 16 Critical Financial Questions

Solve 16 essential financial and operational questions instantly, adjust custom Variable X parameters, and inspect instant mathematical answers in real time.

16 Predefined Cards

Instant Analysis

Pre-programmed cards addressing the most common questions asked by founders, investors, and bank loan officers.

Variable X Tuning

Custom Levers

Adjust single parameters like target average ticket size, rent burden, or valuation multiples to see instant scenario answers.

Advisor Verdicts

Strategic Insight

Every answered card comes with a clear plain-English recommendation explaining how to optimize your operations.

1. Instant Answers During Investor Meetings

During meetings with prospective investors or landlords, you might be asked tough questions: "What is the maximum rent this cafe can support?" or "What happens to our payback timeline if ticket sizes fall by 15%?" Fumbling through spreadsheets during a pitch hurts credibility.

The Dynamic Query Matrix gives you instant, verified answers across 16 critical financial and operational dimensions.

Real-World Scenario: Answering the Landlord Rent Question

You are negotiating a lease for a prime storefront in Jubilee Hills, Hyderabad. The landlord wants ₹1,20,000 monthly rent. You select Query 9 (Rent Burden Ratio) and adjust Variable X. The card immediately shows that at ₹8,00,000 in monthly sales, ₹1,20,000 represents 15.0% of revenue: right at the safety limit. If sales dip to ₹7,00,000, rent burden jumps to an unsafe 17.1%. Armed with this data, you negotiate a base rent of ₹95,000 plus a 4% revenue-share clause, protecting your downside during the opening phase.

✓ Negotiation Edge: Having instant mathematical clarity gives you upper-hand leverage when negotiating leases and equity terms.

2. Step-by-Step Action Guide

  • Step 1: Select Query Card: Click any card in the 16-card grid (e.g., Q4: Minimum Break-Even Sales or Q10: CAC Payback Speed).
  • Step 2: Adjust Variable X Slider: Fine-tune the custom variable box to test custom scenario thresholds.
  • Step 3: Read the Instant Solution Banner: Review the solved numerical output, step-by-step mathematical proof, and strategic advisor verdict.
Live UI Preview: Question Q4 Solution Card
Q4: Minimum Monthly Break-Even SalesSolved: ₹2,64,700/mo

Fixed OpEx: ₹1,80,000 at 68.0% Gross Margin. Required Daily Volume: 34.8 orders at ₹250 AOV.

The Dynamic Query Matrix delivers instant mathematical answers to 16 critical financial questions.

Export Reports & Data: PDF, Excel, and CSV Multi-Format Proposal Compiler

Package professional financial presentations, configure custom section checklists, generate print-ready PDF proposals for landlords and bankers, and download live financial models in Excel.

PDF Pitch Package

For Landlords & Angels

Clean, print-ready executive presentation deck featuring key metrics, break-even charts, setup capital itemization, and advisor audits.

Excel Model (.xlsx)

For CAs & CFOs

Fully structured spreadsheet workbook with unlocked formulas, monthly revenue projections, and capital depreciation schedules.

CSV Raw Data

For Data Analysis

Complete raw tabular export suitable for importing into custom business intelligence dashboards or accounting software.

1. Packaging Your Vision for Stakeholders

A rigorous financial plan is only useful if you can clearly present it to partners, landlords, and bankers. When applying for a bank loan under government credit schemes (like CGTMSE in India) or presenting to commercial property owners, high-quality documentation sets you apart from amateur operators.

Tab 8 lets you compile your live simulation data into a clean, presentation-ready proposal with one click.

Real-World Scenario: Winning Over a High-Street Landlord

Two different cafe concepts are competing for the same corner property in Church Street, Bangalore. Candidate A presents rough handwritten estimates. Candidate B presents a structured 2-page PDF pitch proposal generated from Café Investment Analyzer, showing verified break-even footfall targets, a 4.2-month rent deposit buffer, and a 60/40 capital allocation framework. The landlord selects Candidate B immediately because the financial model proves long-term tenancy stability and zero rent default risk.

✓ Presentation Power: Professional pitch packaging transforms your concept from an unproven idea into a bankable business proposal.

2. Step-by-Step Action Guide

  • Step 1: Choose Package Preset: Select Default Executive Summary (for 2-page landlord presentations) or Complete Proposal (for comprehensive equity due diligence).
  • Step 2: Customize Included Sections: Use checkboxes to toggle specific modules (CapEx itemization, kitchen throughput limits, or partner equity splits).
  • Step 3: Click Download: Generate your PDF report, Excel model, or raw CSV file with a single click.
Live UI Preview: Export Configurator Options
Proposal Package Status🟢 Ready for Generation

✔️ Dashboard Cockpit  |  ✔️ CapEx Matrix  |  ✔️ Fixed OpEx  |  ✔️ Capacity Tuners  |  ✔️ Advisor Audit

Package live operational models into pitch-ready PDF reports or Excel workbooks.

Tutorial 9: The F&B Terminology & Master Glossary Hub

A single source of truth for 50 critical financial, operational, and capital terms. Master parameter definitions, explore dual viewing modes, and understand the strategic impact of every operational lever.

50-Parameter Encyclopedia

Industry Taxonomy

Comprehensive financial definitions categorized by Capital Spending, Kitchen Throughput, Unit Economics, and Operational Costs.

Dual-View Switcher

Display Modes

Switch effortlessly between the Master Explorer Dossier Card grid and the Compact Accordion Table view for fast scanning.

Instant Search & Filter

Real-Time Search

Filter terms by name, abbreviation, or concept in real time, connecting abstract accounting terms with physical cafe operations.

1. The Single Source of Truth for F&B Economics

In hospitality, financial terminology is frequently misunderstood. Operators often conflate Gross Profit Margin with Net Contribution Margin, misclassify Strategic Networking Capital as office IT cables instead of high-return referral platform dues (such as BNI, Rotary, and merchant trade groups), and overlook annual statutory renewal reserves for licenses such as FSSAI, Municipal Health Trade, and Fire NOC.

The Terminology & Glossary (Tab 9 / Info) hub provides a standardized 50-parameter reference guide with plain-English business definitions, operational benchmarks, and strategic impact assessments.

💡 Real-World Scenario: Clarifying Networking Capital vs. Hardware

A founder setting up a specialty cafe in Indiranagar, Bangalore allocated ₹50,000 to "Networking" expecting Wi-Fi routers and internet cables. By checking the Glossary, the founder discovered that in hospitality financial modeling, Strategic Networking Capital represents joining local business referral chapters (like BNI) and community business roundtables. By investing that ₹50,000 into a local business referral seat, the cafe secured ₹65,000 monthly in recurring corporate breakfast catering orders, effectively reducing customer acquisition costs to zero.

✓ Strategic Takeaway: Accurate terminology leads to smart capital allocation. Use the glossary to understand what every budget line item accomplishes.

2. Step-by-Step UI Action Workflow

Searching & Filtering Levers

Step 1: Type in the Instant Search Bar: Enter any term, acronym, or operational alias (e.g. AOSd, LTV, Break-Even, CAC, Networking) to filter the 50 levers instantly.

Step 2: Filter by Category Pills: Click category filters (such as Capital Setup, Revenue & Capacity, Margins, or Retained Growth) to isolate specific business dimensions.

Reading & In-App Integration

Step 3: Toggle Your Preferred View: Choose between Master Explorer View (detailed parameter dossiers with practical examples) and Compact Accordion View (fast tabular reference).

Step 4: Click In-App Info Icons (ⓘ): Throughout the simulator, clicking any info icon automatically opens its exact glossary definition and practical operating rules.

Master System Architecture: How the 9 Computational Engines Power Your Model

A visually engaging, beginner-friendly guide explaining the real-time calculation pipeline, what Tutorials T1 through T9 represent, and how the simulator keeps your entire cafe business model synchronized.

Engine T1

Master Cockpit

Centralized global header stripe controlling capital, revenue targets, profit margins, and base rent across the platform.

Engine T2

CapEx & Runway

Partitions funds using the 60/40 rule, structures Strategic Networking Capital (BNI/Rotary), and tracks monthly cash runway.

Engine T3

Kitchen Speed (AOSd)

Calculates order preparation physics, POS cashier station counts, and physical revenue ceilings to prevent rush-hour choke points.

Engine T4

Payback & Solvency

Renders cumulative cash recovery curves, models target payback milestones, and calculates daily break-even customer order counts.

Engine T5

Regulars & LTV

Applies retention economics to hospitality, calculating Customer Lifetime Value (LTV), blended acquisition cost (CAC), and repeat loops.

Engine T6

Delivery Channels & Splits

Models Swiggy and Zomato commission erosion (18-26%), packaging drag (4%), blended margins, and automated co-founder rupee dividends.

Engine T7

Dynamic Query Matrix

Solves 16 critical financial and operational questions instantly with interactive Variable X sliders for rapid scenario testing.

Engine T8

Pitch Deck Compiler

Generates institutional-grade PDF proposal decks, unlocked Excel models (.xlsx), and raw CSV data files for landlords and investors.

Engine T9

Knowledge Encyclopedia

50-parameter master glossary featuring plain-English definitions, industry benchmarks, and dual Explorer/Accordion reading modes.

1. The 3-Tier Reactive Calculation Loop

Unlike fragile static spreadsheets where modifying one cell frequently breaks formulas without warning, Café Investment Analyzer uses a robust 3-tier reactive pipeline:

1. Global Controls
Capital · Sales · Margin · Rent
2. Calculation Engines
60/40 Split · AOSd Speed · LTV · Break-Even
3. Advisor Guardrails
14 Real-Time Diagnostic Health Alerts

2. How the Platform Prevents Financial Blind Spots

Common Spreadsheet Failure

Isolated Formulas: Changing rent in one cell fails to update daily break-even customer requirements or cash runway on other sheets.

Unmodeled Bottlenecks: Founders project high sales without checking whether one barista station can physically make that many drinks per hour.

Unaccounted Delivery Fees: High online order volumes hide 25% aggregator cuts and packaging costs until the monthly bank balance turns negative.

The Simulator Solution

Reactive Global Sync: Adjusting the rent slider immediately updates daily break-even tickets, margin of safety, and cash runway across all 9 modules.

Physical Throughput Check: The engine links register counts and prep duration (AOSd) to show your true maximum revenue limit.

Blended Margin Engine: Calculates the exact profit impact of Swiggy and Zomato sales and recommends delivery menu markups.

💡 Real-World Scenario: The Multi-Variable Domino Effect

Suppose you find a location with ₹20,000 cheaper rent, but it only has space for 1 barista station instead of 2. In a traditional spreadsheet, you might celebrate saving ₹20,000 in monthly rent. In Café Investment Analyzer, the simulator immediately flags that a 1-station setup caps morning rush revenue at ₹90,000 per month, costing you ₹1,50,000 in potential sales. This allows you to make a fully informed location choice before signing a lease.

✓ System Takeaway: Every financial choice impacts physical operations. The simulator shows both sides of the coin in real time.

Beginner vs. Adaptive vs. Professional Modes: Choosing Your Perfect Financial Sizing Depth

Understand the exact differences between our 3 simulation tiers, discover why each mode exists, and select the right tool depth for your specific stage of cafe ownership.

🌱

Beginner Mode

Guided Playbook

Designed for first-time dreamers and culinary graduates who need a clean, zero-jargon 4-step feasibility validation in under 5 minutes.

⚖️

Adaptive Mode

Balanced Calibration

Built for operating cafe owners and expanding bistro managers who need recipe-level COGS costing, seating turns, and 3-scenario stress testing.

🏛️

Professional Mode

Institutional Depth

Created for commercial restobars, franchise networks, and investor-backed ventures requiring delivery channel splits, partner equity waterfalls, and PDF pitch decks.

1. The Purpose Behind Three Distinct Tiers

Every cafe founder is at a different stage of their journey. A corporate professional exploring their first 150 sq ft coffee kiosk in Bangalore does not need complex discounted cash flow (DCF) models or multi-partner equity dividend matrices on day one. Showing too many dials creates analysis paralysis.

Conversely, a multi-outlet operator expanding into a 60-seat rooftop bistro in Koregaon Park, Pune needs deep recipe COGS controls, peak-hour seating turnover tuners, and aggregator delivery commission dilution modeling.

🎯 Real-World Scenario: Matching Mode to Founder Stage

Rahul has ₹15 Lakh savings and wants to open a quick-service coffee kiosk. Launching in Beginner Mode guides him through 4 plain-English questions, validating that a ₹15 Lakh fund requires 42 daily customers to break even. Six months later, as Rahul plans a second 40-seat dine-in outlet with an equity partner, he switches to Professional Mode to model 60:40 partner equity splits and Swiggy delivery margin erosion.

✓ Strategic Takeaway: Start simple with Beginner Mode to validate core feasibility, then step up to Adaptive or Professional mode as operational complexity grows.

2. The 4 Strategic Pillars Routing Matrix

The platform is organized around 4 Strategic Pillars that route you directly to the appropriate simulation depth:

Pillar 1: Capital & CapEx Allocation

Goal: Prevent opening day insolvency by enforcing the 60/40 setup vs. runway rule.

Best Tier: Beginner Mode for simple budget sizing; Professional Mode for vendor invoice overrides and BNI/Rotary networking dues.

Pillar 2: Kitchen Throughput & Speed

Goal: Eliminate rush-hour queues and match physical prep speed to sales targets.

Best Tier: Adaptive Mode for seating turnover; Professional Mode for register count physics.

Pillar 3: Unit Economics & Customer LTV

Goal: Turn one-time footfall into high-value weekly regulars.

Best Tier: Adaptive Mode for recipe gross margins; Professional Mode for customer lifetime value (LTV) and CAC multiplier modeling.

Pillar 4: Risk Safeguards & Compliance

Goal: Maintain 3.5+ months cash runway and secure Indian statutory licenses.

Best Tier: Beginner Mode for cash safety checks; Professional Mode for FSSAI, Fire NOC, and Health Trade renewal funds.

The Beginner Mode Guided Playbook: Zero-Jargon Feasibility for First-Time Founders

A straightforward, 4-step roadmap designed for novice cafe entrepreneurs to test startup budgets, check daily customer targets, and verify safety reserves without getting lost in spreadsheets.

1️⃣

Step 1: Budget

Starting Fund

Enter your total cash in hand. The playbook instantly separates your physical setup budget from your emergency cash buffer.

2️⃣

Step 2: Location

Rent & Traffic

Enter quoted landlord rent. The engine verifies whether the location's pedestrian footfall supports your rent burden.

3️⃣

Step 3: Daily Target

Orders/Day

Discover the exact daily order count your cash register must ring up before the business makes its first rupee of profit.

4️⃣

Step 4: Safety Check

Survival Buffer

Verify that your liquid bank reserves provide at least 90 to 120 days of survival during slow initial opening months.

1. Why First-Time Founders Need a Guided Playbook

Starting a cafe is an emotional milestone. Too often, aspiring owners spend weeks designing logos, curating playlists, and picking ceramic mugs while leaving basic financial questions unaddressed: "How many coffees must I sell every morning just to pay the electricity bill?"

Beginner Mode strips away financial complexity, guiding you through 4 conversational questions that give you immediate go/no-go clarity on your cafe dream.

☕ Real-World Scenario: The Indiranagar Specialty Kiosk

Ananya is a recent culinary institute graduate with ₹15 Lakh in startup funds. Using Beginner Mode, she enters ₹15 Lakh total capital and ₹45,000 monthly rent for a 120 sq ft kiosk. The playbook calculates: Setup CapEx is capped at ₹9.5 Lakh, leaving ₹5.5 Lakh in bank reserves (4.8 months runway). Her daily break-even target is 28 orders at ₹220 average ticket. Because the metro entrance outside sees 800 commuters hourly, capturing 28 daily orders is highly achievable.

✓ Confidence Boost: In under 3 minutes, Ananya proves her kiosk model is financially sound before signing the commercial lease.

Adaptive Mode: Recipe-Level COGS, Table Turnover, and Multi-Scenario Stress Testing

Fine-tune food cost percentages, model seating turnover rates across dayparts, and stress-test your business model across optimistic, realistic, and conservative scenarios.

🍳

Recipe COGS Costing

Ingredient Accuracy

Model exact ingredient costs for coffee beans, dairy, syrups, and bakery items to protect your 68% to 72% gross margin target.

🪑

Table Turnover

Seating Dynamics

Calibrate dine-in seating capacity, average dining duration (45 vs 75 mins), and peak-hour table utilization rates.

📊

3-Scenario Testing

Risk Sensitivity

Compare financial outcomes across Conservative (-25% sales), Base Case, and Optimistic (+25% sales) market conditions.

1. Operational Precision for Growing Concepts

Once a cafe concept moves past basic feasibility, the key to healthy profits lies in menu engineering and seating efficiency. In dine-in cafes, tables occupied by guests working on laptops for 3 hours on a single ₹180 iced latte can severely restrict your revenue during peak lunch hours.

Adaptive Mode gives you the levers to model table turnover, calibrate recipe costs, and test how inflation in milk or coffee beans affects your bottom line.

🪑 Real-World Scenario: The Seating Turnover Dilemma

A 35-seat bistro in Koregaon Park, Pune experiences a 2.5-hour average guest dwell time on weekdays. In Adaptive Mode, simulating an increase in table turns from 1.5 to 2.8 turns per day (achieved by introducing high-speed express lunch combos and community work tables with timed seating) lifts monthly revenue by ₹1,65,000 without requiring any additional kitchen equipment.

✓ Operational Lever: Optimizing table turnover during 12:00 PM to 3:00 PM produces immediate profit gains with zero additional rent.

Professional Mode: Full Institutional Depth, Multi-Channel Delivery Splits & Pitch Packages

Unrestricted access to contractor setup overrides, Swiggy/Zomato commission dilution, partner equity waterfall dividends, and board-ready PDF pitch packages.

🏛️

Full Institutional Depth

Unrestricted Access

Custom vendor overrides, granular statutory licensing funds (FSSAI, Fire NOC, Health Trade), and multi-year depreciation schedules.

🛵

Multi-Channel Splits

Delivery Dilution

Model aggregator commission drag (18-26%), packaging overhead (4%), and blended gross margin equations across dine-in and delivery.

📑

Pitch Compiler

Bank & Landlord Ready

Generate print-ready PDF proposals, unlocked Excel financial models (.xlsx), and raw CSV datasets for equity partners and bank lenders.

1. Institutional Precision for High-Stakes Hospitality

When pitching institutional angel investors, commercial property owners, or applying for bank term loans under schemes like CGTMSE, high-level estimates are not enough. Sophisticated stakeholders expect granular line items: lease deposits, contractor fitout warranties, referral platform dues, and precise partner dividend distribution structures.

Professional Mode provides the complete institutional toolkit, allowing you to fine-tune every line item and generate courtroom-tested financial documentation in seconds.

🏛️ Real-World Scenario: The 2-Founder Equity Waterfall

Two entrepreneurs are launching a ₹50 Lakh flagship coffee lounge in Jubilee Hills, Hyderabad. Partner A provides 60% of capital; Partner B operates the outlet full-time. In Professional Mode, they configure the Partner Equity Split slider to 60:40 and set up statutory license renewal reserves. At ₹12 Lakh monthly sales and 18% net profit margin, Partner A receives ₹1,29,600 monthly dividends while Partner B receives ₹86,400, eliminating future co-founder equity disputes.

✓ Governance Power: Pre-agreeing on transparent financial formulas protects partnerships and strengthens investor trust.

From Pitch Decks to Stress Tests: 4 Crucial Scenarios Where This Calculator Saves Ventures

Most cafes fail because their assumptions were never tested. Here are four real-world scenarios showing how you can use this simulator to protect your cash and prove your model before spending a single rupee.

In the culinary world, enthusiasm is cheap, but mistake-prone execution is incredibly expensive. Aspiring cafe owners often rush to sign lease agreements and buy commercial espresso machines without running scenario simulations. By treating the Cafe Investment Analyzer as a sandbox, you can stress-test your assumptions across distinct business situations.

"The cheapest place to fail is on a digital canvas. A slider adjustment costs nothing; a wrong lease deposit or equipment purchase costs lakhs."

Use Case 1: Pitching to Co-Founders & Angel Investors

When presenting your business idea to potential financial partners, presenting a vague "we'll make ₹5L a month" is a surefire way to lose credibility. Investors want to see capital structure, payback speeds, and partner splits.

How to execute this scenario:

  1. Set your total capital in Full Investment.
  2. Go to the Operations & Split tab and set the Partner Equity Split Slider (e.g. 60% Partner A / 40% Partner B). The analyzer instantly displays the monthly dividend share in rupees for each partner.
  3. Toggle to the Export Reports tab, select the checkboxes for Dashboard, CapEx, OpEx, and Operations, and click PDF Report. You now have an institutional-grade attachment for your pitch deck.

Use Case 2: Stress-Testing the Cash Runway Against a Slow Launch

Virtually no cafe opens to full capacity on day one. A slow launch with high fixed costs is the primary cause of early insolvency. You must model your "Burn Rate" and see how many months of reserves you have.

How to execute this scenario:

  1. In the global header, set your Expected Sales to a conservative slow-month figure (e.g., ₹2,00,000).
  2. Toggle to the Business & Growth tab and inspect the Monthly Cash Burn and Calculated Runway cards.
  3. If your runway shows less than 3 months, you are in the danger zone. Adjust your One-Time CapEx downwards or reallocate setup funds to your working capital reserves until your runway supports at least 4-6 months of slow-sales survival.
Live UI Preview: Cash Runway Diagnostic
Cash Runway 🚨
1.8 Months
🔴 Critical: Reserves depleted in 54 days.

A low monthly sales volume increases your Net Burn, reducing your runway and triggering warning flags.

Use Case 3: Choosing the Right Location (City Tier Presets)

Should you open a high-rent metro cafe (Tier 1) or a cozy regional town cafe (Tier 3)? This is a classic trade-off between volume/pricing power and operating overheads.

How to execute this scenario:

  • Step A (Tier 1 Metro): Click the Tier 1 (Metro) pill on the Dashboard. Notice how the default investment escalates to ₹40L, AOV increases to ₹220, and Expected Sales rise to ₹18L. Check the payback period.
  • Step B (Tier 3 Regional): Click the Tier 3 (Regional) pill. The capital scales down to a lean ₹12L, the staff wage drops, and the AOV adjusts to ₹110.
  • Step C (Analysis): Compare the payback timelines of the two models. Often, a Tier 3 cafe with low rent can pay back its initial capital *faster* than a flashy Tier 1 metro cafe, despite having lower sales. Use this to determine your risk appetite.

Use Case 4: Optimizing Blended Margins with Swiggy & Zomato

Relying heavily on delivery aggregators helps build volume but can destroy your margins due to high commission rates (18-25%).

How to execute this scenario:

  1. Go to the Operations & Split tab.
  2. Slide the Delivery Channel Share Slider to 60% (meaning 60% of your orders are online delivery) and set Aggregator Commission Slider to 22%.
  3. Inspect the calculated Blended Profit Margin. If it drops below 15%, your business is highly vulnerable. Slide the delivery share down (simulating marketing in-store walk-ins) to see how your blended margin recovers.

Decoding the Cafe DNA: 4 Surprise Metrics That Predict Cafe Success or Failure

Most founders look only at monthly sales and rent. But the true predictors of cafe survival are hidden deeper. Let's explore four counter-intuitive insights this analyzer calculates for you.

Cafe operations are highly integrated financial systems. A change in food costs affects your break-even point; a change in order service speeds alters your maximum sales ceiling; a shift in staff wages changes your required AOV. To help you look beyond basic accounting, the Cafe Investment Analyzer calculates four key operational metrics that act as early warning systems.

"The secret to cafe survival isn't selling more coffee; it's ensuring your transaction throughput aligns with your capacity limits."

Insight 1: The Capacity Glass Ceiling (The AOSd Constrained Ceiling)

Many founders believe that if their cafe gets popular, their sales will grow indefinitely. In reality, you are limited by physical throughput. If you have 4 registers and each order takes 8 minutes (AOSd) to prepare, your kitchen can process a maximum of 30 orders per hour. At an AOV of ₹150, your absolute sales ceiling is ₹45,000 per 10-hour day.

No amount of marketing or demand can push sales beyond this physical limit. If your expected sales target is set above this ceiling, the analyzer's Kitchen Bottleneck Alert fires. You must speed up preparation (AOSd), add service stations, or raise ticket size (AOV) to grow.

Insight 2: The LTV-to-CAC Ratio (Customer Acquisition Efficiency)

On the Business & Growth tab, the calculator displays a SaaS metric: the LTV to CAC Ratio. Why does this matter for a physical coffee shop?

  • CAC (Customer Acquisition Cost): The amount you spend on social media ads and discounts to get one new customer through the door.
  • LTV (Customer Lifetime Value): The gross profit a customer contributes based on how often they return.

If your LTV to CAC ratio is below 3x, your cafe is losing money on customer acquisition. The most effective way to fix this isn't spending more on advertising: it is boosting the Repeat Customer Rate slider (building loyalty, subscriptions, or customer experience) to stretch the customer lifespan.

Live UI Preview: LTV to CAC Health Indicator
LTV to CAC Ratio 🟢 Healthy (4.2x)

Customer Lifetime Value (INR 840) is 4.2x greater than Customer Acquisition Cost (INR 200).

A healthy ratio (>= 3x) shows highly efficient growth loops, confirming that your marketing spend is profitable.

Insight 3: The Blended Margin Commission Erosion

Opening a cafe and relying 100% on home-delivery seems low-risk. However, since food aggregators charge an average 18-25% commission on the total order value, they effectively consume a massive portion of your net profit margin.

If your default cafe margin is 20%, and 50% of your sales go through delivery aggregators charging 20% commission, your Blended Profit Margin drops to 10%. Under this commission erosion, your payback period doubles. You must balance the channel split carefully to keep margins healthy.

Insight 4: The Coordinated Diagnostics Advisor

At the bottom of the dashboard is the Coordinated Diagnostics Panel. This is a real-time rules engine that runs multiple checks simultaneously. It flags warning signs like:

  • Labor Costs Exceed Safe Ratio: Warning if total salaries eat more than 40% of Expected Sales.
  • Low Capacity Utilization: Warning if your Expected Sales utilize less than 30% of your kitchen's physical capacity, indicating idle staff and machinery.
  • Short Runway Buffer: Warning if your working capital reserves cover less than 3 months of operational burn.

By keeping this diagnostic panel in the green (🟢 Balanced Model), you ensure that your business is structurally sound before launch.

Aligning the Table: Who is the Cafe Investment Analyzer Built For?

A successful cafe is a highly aligned system. Let's look at why founders, operational managers, investors, and commercial landlords all rely on this platform to coordinate their plans.

When someone mentions a "cafe layout", they usually think about cozy chairs, warm lighting, and a shiny espresso machine. But the true layout of a cafe is financial. If you are entering the food & beverage (F&B) industry, you must align multiple stakeholders. If you don't, you run the risk of building a cafe that you love, but that your investors distrust and your kitchen cannot support.

"In a successful cafe, the kitchen, the cash register, and the cap table must speak the same language."

1. Aspiring Founders (The Passionate Beginners)

For beginners, the greatest barrier to entry is the complexity of standard finance tools. Most founders start with a dream, not a degree in accounting. They need a sandbox to translate their menu plans into setup CapEx budgets and operating margins without getting bogged down in cell formulas.

Stakeholder Workflow: By adjusting the Full Investment and AOV, a beginner can immediately see if their dream of a high-end specialty coffee house matches the math of their starting cash reserves, turning abstract budgets into concrete setup categories.

Live UI Preview: Asset Allocation Breakdown
One-Time CapEx Setup (66%)
₹16,50,000
Operating Runway (34%)
₹8,50,000

The model ensures a healthy 60/40 balance between physical setup and starting runway.

2. Operational Managers (The Throughput Champions)

Operational leaders are responsible for the physical kitchen bottleneck. They don't just care about the payback period; they care about customer queue times, preparation speeds, and staff counts.

Stakeholder Workflow: They use the Capacity Tuner to test how a shift in Average Order Service Duration (AOSd) from 8 minutes down to 5 minutes changes their daily transaction capacity. It aligns staff rosters directly with target sales volume.

3. Angel Investors & Equity Partners (The Risk Mitigators)

Investors seek financial feasibility, return speeds, and equity dividend dividends. They use the tool to run a quick audit of the business plan before writing a check.

Stakeholder Workflow: By reviewing the Payback Period against the Target Threshold, and adjusting the Partner Equity Split slider, investors can model their exact monthly returns under varying sales conditions, eliminating guesswork from negotiations.

4. Commercial Landlords (The Real-Estate Anchors)

Landlords want tenants who pay rent on time and remain in business for years. A tenant who doesn't understand their break-even point is a high-risk tenant.

Stakeholder Workflow: Aspiring cafe owners use the Break-Even Sales outputs to show landlords exactly how many customer transactions are needed daily to cover the lease, building landlord trust and securing better contract lease terms.

The Operators' Blueprint: 3 Business Profiles Making the Best Use of This Simulator

A specialty coffee lounge operates on completely different margins and speeds than a busy transit station kiosk. Let's explore how three operator profiles use this simulator to optimize throughput.

Profits in a coffee shop are won in seconds and pennies. If you don't model your service bottlenecks, your customers will vote with their feet. The Cafe Investment Analyzer is not a generic calculator: it is an operational simulator. Let's look at three operator profiles that use this tool to build their strategic blueprints.

"A business model is only as good as its weakest bottleneck. If your kitchen takes 15 minutes to make a latte, it doesn't matter how beautiful your lounge is."

Profile 1: The High-Volume Commuter Kiosk

These operators set up small kiosks in high-traffic metro stations or business parks. Their business model relies entirely on speed and transaction volume. Their average ticket size (AOV) is low, meaning they must process hundreds of orders during morning rushes.

How they use the tool to optimize throughput:

  • They set a low AOV (e.g. ₹80) and set Active Stations to 3 or 4.
  • They slide the AOSd (Order Duration) to 2 or 3 minutes, simulating a highly streamlined menu (batch brews, grab-and-go cups).
  • They check the Maximum Daily Sales Capacity Limit to make sure their kitchen layout and cashier register count support their target commuter volume.
Live UI Preview: High Volume Kiosk Throughput
Physical Order Throughput 🟢 Speed Optimized (2 mins)

4 Stations at 2 mins/order = 120 orders/hour capacity. Supporting ₹18,000/hour sales ceiling at ₹150 AOV.

Shaving prep speeds down prevents customer checkout bottlenecks during rush hours.

Profile 2: The Multi-Partner Specialty Coffee Lounge

These cafes focus on premium slow-brews, dining options, and a comfortable atmosphere. Their AOV is high, but their transaction counts are lower and customer seat time is longer. They also involve multiple partners who invest setup capital.

How they use the tool to optimize throughput:

  • They set a high AOV (e.g. ₹350) and a longer AOSd (e.g. 10 minutes) reflecting manual pourovers and kitchen dining orders.
  • They override the default CapEx table amounts in the CapEx & Working Capital tab to input high premises deposits and custom interior layout costs.
  • They use the Partner Equity Split Slider on the Operations tab to manage dividend expectations and ensure the payback speed aligns with all partners.

Profile 3: The Expanding Multi-Branch Franchise

These are established brands looking to replicate their success across new cities. They need to test if their metro store layout is financially viable in regional towns.

How they use the tool to optimize throughput:

  • They toggle between the Tier 1 (Metro), Tier 2 (Default), and Tier 3 (Regional) presets on the Dashboard.
  • They analyze the shift in Staff Wages, Real Estate Rent, and AOV.
  • They determine if their regional branches require a leaner staffing count (e.g. 2 FTE baristas instead of 8) to maintain healthy payback periods under lower local sales targets.

The Cost of Blind Planning: Why Trial-and-Error is a Dangerous Path in Cafe Ventures

Many founders believe they must learn through painful failure. But in modern F&B, R&D by failure is a costly, avoidable trap. Here is the financial reality of planning without simulation.

There is a romantic myth in business: that failure is a necessary badge of honor, and that trial-and-error is the only path to wisdom. While resilience is vital, losing your life savings on a lease you couldn't afford is not a mandatory step to becoming a successful restaurateur. When you plan without a simulator, you are playing blind. Let's break down the three most common financial traps that catch blind founders, and how you can sidestep them.

"An amateur learns by losing their capital; a professional simulates the losses on a screen and opens only when the model is balanced."

Trap 1: The Cash Runway Gap (Insolvency in Month 4)

Aspiring cafe owners often spend 100% of their cash setting up the store: painting the walls, buying premium espresso cups, and paying deposits. When they open, they expect to make profits on day one. But if sales are slow during the first three months, they have no cash left to pay rent or staff salaries. They go insolvent because they lacked a runway.

What you miss by not using the tool: The calculator enforces a strict 60/40 rule, reserving 34% of your investment capital as a dedicated working capital buffer. The Business & Runway tab calculates your net cash burn rate and tells you exactly how many months of slow sales you can survive.

Live UI Preview: Cash Runway Alert
Runway Status ⚠️
1.5 Months
🚨 Warning: Cash runway is below the safe 3-month buffer.

The simulator flags low working capital reserves before you spend your setup budget.

Trap 2: The Physical Capacity Bottleneck

Imagine writing a business plan that assumes your cafe will make ₹15,00,000 a month in sales. You hire staff, buy ingredients, and lease a high-rent metro corner. But because you have only 2 baristas and a slow espresso machine, your staff takes 10 minutes to process each order. During peak hours, customer queues grow long, people get tired of waiting, and they walk away.

Your actual physical maximum sales volume is only ₹6,00,000. Your business fails because your target sales were physically impossible.

What you miss by not using the tool: The analyzer's Theoretical Capacity constraint calculator runs live checks. If your Expected Sales target is set higher than what your stations and prep speeds can physically process, it triggers a warning banner, telling you to add cashiers or speed up prep times *before* you open.

Trap 3: Delivery Aggregator Margin Erosion

Many owners list their menu on Swiggy and Zomato, see a massive spike in order numbers, and assume they are succeeding. However, aggregators charge an average 18-25% commission on delivery sales. If you don't calculate your "blended margin" (dine-in margin vs. commission-reduced delivery margin), you can easily end up in a situation where you are doing high sales volume but making zero net profit.

What you miss by not using the tool: The Operations & Splits page lets you simulate your delivery channel share (e.g. 40% delivery) and commission rate, showing you the exact blended margin erosion and post-commission profit pool in real time.

Understanding the Levers: A Conceptual Learning Guide to the Simulator's Variables

Not all parameters are created equal. Let's walk through a beginner-friendly breakdown of every input slider, its business scope, and who on your team is meant to manage it.

A simulation engine is only as powerful as your understanding of the controls. If you treat every slider the same, you won't know which variables are macro-level business assumptions and which are micro-level kitchen operational inputs. The Cafe Investment Analyzer divides its features into five distinct scopes. Let's analyze what each slider accomplishes and who owns it.

"If you don't know who owns a slider, nobody manages the risk. Assign each variable to the right partner before you launch."

1. Executive Scope (Meant for Founders & Investors)

These are the global parameters displayed in the header. They dictate the size of your business box. They define your starting budget, sales expectations, and target net margins.

  • Full Investment (₹): Sets the total capital. Changing this scales the setup CapEx and working capital runway base.
  • Expected Sales / Month (₹): Sets the top-line target. Dictates the revenue inflow.
  • Expected Profit Margin (%): Sets the target bottom-line return percentage.

Strategic Impact: These three parameters are the absolute baseline of your venture. Founders and equity partners must align on these numbers before designing menus or hiring staff.

2. Strategic Capital Scope (Meant for Co-Founders & Accountants)

Located on the CapEx & Working Capital tab, this scope breaks down capital allocations into two major types: Setup costs and Operational Runway.

  • One-Time CapEx Setup: Upfront fixed assets (lease deposits, interior setup, commercial espresso machinery, licenses).
  • Monthly Working Capital: Monthly operational reserves (salaries, ingredients, rent, utility, advertising).

Strategic Impact: Overspending on setup CapEx is the most common beginner mistake. This tab allows accountants and co-founders to override baseline estimates to ensure at least a 3-month operating cash buffer remains liquid.

Live UI Preview: CapEx Setup Table
Machinery Allocation (12%)
₹3,00,000
Interior Layout (15%)
₹3,75,000

You can override these allocation cells to model real contractor quotes.

3. Operational Scope (Meant for Kitchen Managers & Operators)

Located on the Sales & Margins tab, this scope details physical kitchen constraints. These parameters represent the practical reality of service speed.

  • Active Stations (Registers): The number of parallel service lines.
  • AOSd (Average Order Service duration): Preparation speed in minutes per order.
  • AOV (Average Order Value): Expected customer bill size.
  • Operating Days & Hours: Monthly schedule limits.

Strategic Impact: Kitchen managers own these sliders. They must optimize kitchen workflows to keep AOSd low. If AOSd creeps up, the register stations become a bottleneck, making target sales impossible.

4. Structural Cost Splits (Meant for Business Partners)

Located on the Operations & Split tab, these variables allocate profits and manage delivery platform channels.

  • Delivery Channel Share & Aggregator Commission: Simulates online order dependency and aggregator commission erosion (18-25%).
  • Partner Equity Split: Determines the monthly profit share dividend for Co-Founder A and Co-Founder B.

Strategic Impact: This scope handles structural relationships. Partners use this to model blended margins and prevent disputes over cash distributions.

5. Growth Scope (Meant for Marketers & Growth Directors)

Located on the Business & Growth tab, these sliders model long-term customer value and acquisition efficiency.

  • Repeat Customer Rate & Visits/Month: Measures loyalty and transaction frequency.
  • Customer Lifespan (Months): Average months a customer remains active.

Strategic Impact: Marketers use this to track CAC vs. LTV. A higher repeat rate reduces CAC pressure, allowing the cafe to grow profitably.

Funding Secured: How to Package Your Exported Reports for Cafe Financing

A financial model in your browser won't pay a contractor. Let's walk through how co-founders, banks, and angel investors utilize the export engines to secure financing and buy-in.

Opening a commercial cafe requires securing external capital, whether through bank loans, co-founder contributions, or equity from angel investors. Investors do not write checks based on a casual verbal promise. They need to see a detailed, professional business case. The Cafe Investment Analyzer's Export System is designed to translate your interactive calculations into institutional-grade documentation.

"An investor doesn't invest in a dream; they invest in a documented plan. An exported PDF sheet is the proof that you've done the work."

1. The PDF Report: Securing Bank Loans & Leases

Bank loan officers and premium commercial landlords require structured, non-editable summaries. They want to see key metrics, allocations, and compliance checks without digging into raw math equations.

The Strategic Asset: The analyzer's PDF engine automatically structures your plan, cleans up emojis, and compiles your live charts (the CapEx Allocation Doughnut and cumulative Payback Timeline) into a clean, print-ready document. It proves to bankers that you understand cash runways and debt-service capacities.

Live UI Preview: Export Report Configurator
Report Components Checklist 🟢 Ready to Export

✔️ Dashboard KPI Summary  |  ✔️ CapEx Setup Assets  |  ✔️ OpEx Working Capital  |  ✔️ Capacity Tuners

Choose which modules to package into your strategic funding proposal.

2. The Excel Workbook: Winning Over Angel Investors

Experienced business partners and angel investors rarely trust a static PDF. They want to check your math, test custom growth rates, and audit your expense assumptions.

The Strategic Asset: The SheetJS-powered Excel export compiler packages your live calculations into a clean multi-tab spreadsheet. It organizes your capital, sales, operations, and Q&A solutions into structured tabs, giving investors the raw foundation they need to validate your model.

3. The CSV Data Sheet: Merging with Business Intelligence

If you are an operator expanding an existing brand, you likely use external business intelligence (BI) tools (like Tableau or PowerBI) or custom developer databases.

The Strategic Asset: The CSV export engine strips away layout styles and provides clean database strings. This allows data analysts to plug your simulation directly into corporate dashboards to compare with historical store performance.

Step-by-Step Guide to Packing an Investor Proposal

  1. Calibrate the Model: Adjust the global controls and tab sliders to reflect your target location's rent and wage rates.
  2. Resolve Diagnostics: Double-check the Operational Advisor. Make sure no red "Danger" cards are triggered (such as a low cash runway or a capacity bottleneck).
  3. Configure the Report Preset: Go to the Export Reports tab and click the Complete preset. This checks all options, ensuring your PDF contains a full overview.
  4. Export PDF & Excel: Generate your PDF report for presentation, and download the Excel file as a supplemental attachment.
  5. Pitch with Confidence: Attach the PDF to your pitch deck. You now have documented, institutional-grade proof that your cafe model is structurally sound.

The Philosophy of Simulation: Why We Built the Cafe Investment Analyzer

Traditional business planning is broken. Read about the core purpose, positioning, and philosophy of bridging operational kitchen limits with corporate finance.

Traditional business planning suffers from a fundamental divide. On one side, you have abstract corporate finance: spreadsheets filled with net present values (NPV) and return rates, created by people who have never worked a day in a commercial kitchen. On the other side, you have raw cafe operations: baristas managing milk temperatures and cashiers handling morning queues, without checking the capital recovery schedule. Most cafe failures happen in the gap between these two worlds.

"The ultimate purpose of planning is not to predict the future, but to prepare you to adjust variables when reality changes."

1. Visualizing Financial Interdependency

Traditional Excel templates hide interdependency behind dry formulas. If you want to see how a change in barista wages affects your break-even payback period, you have to click through multiple cells and trace formulas. Many founders ignore these relationships because they are invisible.

The Design Philosophy: The Cafe Investment Analyzer makes interdependency visible. By linking parameters to real-time range sliders, the tool turns financial modeling into a tactile, visual experience. When you adjust the staff wage slider, you immediately see the payback line chart move, demonstrating the compound impact of every operational choice.

2. Bridging Operations and Finance

A business model must be operationally achievable. If your financial sheet assumes you will make ₹15L in monthly sales but your cashier station count limits you to ₹6L, your model is a work of fiction. This calculator bridges that gap by connecting operational constraints (AOSd, register channels, operating hours) directly to financial metrics (break-even volume, cash runway, payback period).

Live UI Preview: Advisor Diagnostic Engine
Model Status 🟢 Balanced Model

All parameters checked. Capacity supports sales target, labor is within safe limits, and opex runway is secure.

The rules engine monitors your variables to keep your operations and finance in sync.

3. Democratizing Professional Planning

F&B planning has historically been divided into two groups: large franchises with corporate finance teams, and independent founders relying on intuition and trial-and-error. We built this analyzer to democratize professional planning. By standardizing industry baselines and building in a real-time diagnostics advisor, we give independent founders access to the same strategic checks used by global brands, helping them avoid costly traps.

4. Positioning: An Active Simulator, Not a Historical Ledger

Traditional accounting tools look backward: they tell you how much money you lost last month. This tool is positioned forward-looking: it is a simulator. It allows you to model future scenarios, test risk margins, and identify bottlenecks before you commit capital. It ensures that when you finally open your cafe door, you are executing a validated model, not taking a blind gamble.

Rahul’s First Chai & Coffee Corner: A Step-by-Step Beginner Story

Meet Rahul from Pune. With ₹10 Lakhs in savings and no finance background, see how he used the simulator to plan his dream college campus corner without getting lost in math.

Rahul is a 24-year-old fresh graduate in Pune with a dream of starting a cozy tea and coffee spot near a college campus. He saved ₹10 Lakhs with help from his family. But every time he tried to use complex Excel sheets, he got stuck. Concepts like capital allocations and cash runways felt like a foreign language.

"I didn't need a 50-page financial report. I just wanted to know if my ₹10 Lakhs would cover my espresso machine, rent, and staff until sales picked up."

Step 1: Setting the Global Budget

Rahul opened the Cafe Investment Analyzer and set the Full Investment slider to ₹10,00,000. The calculator automatically split his money into two clean categories: ₹6,60,000 for setup CapEx (machinery, counters, decor) and ₹3,40,000 for a 3-month operational cash runway buffer.

Live UI Preview: Rahul's ₹10L Baseline Setup
Projected Payback Period 🟢
11.2 Months
✅ Target Achieved: Below the safe 12-month return threshold.

With ₹2.4L expected sales/month, Rahul's model reaches full capital recovery in under a year.

Step 2: Inputting Simple Menu Expectations

Next, Rahul estimated his daily sales. He expected to sell around 100 items daily (coffee, chai, and bun maska) at an Average Order Value (AOV) of ₹80. This gave an expected monthly sales volume of ₹2,40,000 at a 20% net margin target.

Step 3: Checking the Payback Green Line

He checked the Payback Period KPI Card. It showed 11.2 Months: comfortably below his target threshold of 12 months. The card glowed green, proving his small campus cafe was structurally viable!

Step 4: Downloading a Pitch Report for his Family

Rahul clicked the Export PDF button on the header to generate a clean, one-page business summary to show his parents and bank manager, securing their full backing.

Priya’s High-Margin Espresso Bar: Managing Operating Cash & Barista Capacity

Priya is an experienced barista in Bengaluru. Learn how she tuned prep speeds (AOSd) and staff payroll to build a profitable 25-seat specialty coffee lounge in Koramangala.

Priya worked as a head barista in Bengaluru for 6 years before deciding to launch her own specialty coffee bar with a budget of ₹25 Lakhs. She knew that serving great specialty coffee wasn't enough: if morning rush queues got too long or barista payroll ate up all profits, the business would fail.

"In Koramangala, tech workers want their pourovers and lattes fast. If your barista takes 10 minutes per order, your customers walk out the door."

Step 1: Customizing Commercial Espresso Machinery CapEx

Priya went to the CapEx & Working Capital tab. She overrode the baseline setup values to allocate ₹4,50,000 specifically for a top-tier dual-boiler commercial espresso machine and high-precision grinder, ensuring top beverage quality.

Step 2: Tuning Kitchen Throughput (AOSd & Stations)

On the Sales & Margins tab, Priya set her Active Stations to 2 (two baristas working in parallel) and set her Order Duration (AOSd) to 4 minutes. The theoretical capacity engine calculated a maximum sales ceiling of ₹12,00,000/month, easily supporting her target sales of ₹6,50,000.

Live UI Preview: Priya's Kitchen Capacity Tuner
Throughput Capacity Check 🟢 Capacity Safe

2 Stations @ 4 mins prep = 60 orders/hr max. Maximum revenue ceiling ₹12L vs ₹6.5L expected sales.

Tuning prep speed guarantees kitchen capacity easily handles morning rush volumes.

Step 3: Controlling Labor-to-Sales Ratios

She hired 4 full-time baristas at ₹22,000/month. The Coordinated Advisor verified her labor costs (₹88,000/month) equaled 27% of expected sales: staying well below the dangerous 40% threshold.

Karan’s Hybrid Cafe & Delivery Kitchen: Blended Margins, Swiggy/Zomato Commissions, & LTV/CAC Economics

Karan operates a high-volume hybrid cafe and cloud kitchen in Mumbai with ₹40 Lakhs capital. Discover how he solved delivery commission erosion and tracked SaaS-style growth metrics.

Karan’s flagship store in Bandra generated high monthly sales of ₹15,00,000. However, 50% of his orders came through delivery platforms like Swiggy and Zomato. Despite high top-line revenue, his net monthly bank balance was barely breaking even.

"High order volume on delivery apps can be deceiving. If food aggregators take a 22% cut, your profit margin disappears into thin air."

Step 1: Simulating Delivery Channel Commission Erosion

Karan opened the Operations & Split tab and set his Delivery Share to 50% and Aggregator Commission to 22%. The simulator revealed that his blended net margin dropped from 22% down to 11%! To recover his profits, he adjusted his online prices by 15% to offset aggregator fees.

Live UI Preview: Karan's SaaS Growth & LTV/CAC Ratio
LTV to CAC Ratio 🟢 High Efficiency (5.08x)

Customer LTV: ₹4,320  |  Acquisition Cost (CAC): ₹850. Repeat visit rate: 3.2x/month.

High repeat customer frequency drives strong long-term unit economics.

Step 2: Analyzing SaaS-Style LTV-to-CAC Ratios

On the Business & Growth tab, Karan input his marketing spend and repeat customer metrics: 3.2 visits/month with a 12-month customer lifespan. His calculated LTV was ₹4,320 against a CAC of ₹850, delivering a healthy 5.08x LTV:CAC ratio.

Arjun’s 5-City Expansion: Scaling Franchises Across Tier 1, Tier 2, and Tier 3 Cities

Arjun expanded his cafe brand across state lines. Discover how he used City Tier location presets and partner dividend splits to manage regional franchisee stores.

Arjun successfully ran two metro cafes in Delhi. When franchise inquiries came from Jaipur (Tier 2) and Udaipur (Tier 3), he knew he couldn't apply Delhi rent and wage structures to regional towns.

"A metro cafe model will fail in a Tier 3 city if you force high overheads on the local franchisee. You must calibrate rent and AOV to local market reality."

Step 1: Calibrating City Tier Presets

Arjun used the Tier 1 (Metro), Tier 2 (Default), and Tier 3 (Regional) preset buttons on the dashboard. He saw rent ratios drop from 15% in Delhi down to 8% in Udaipur, while expected AOV adjusted from ₹280 to ₹140.

Live UI Preview: Regional Franchise Cost Calibration
Tier 1 Metro Rent
15% (₹90,000/mo)
Tier 3 Regional Rent
8% (₹24,000/mo)

Location presets adjust fixed rent and wage baselines for regional store branches.

Step 2: Structuring Franchise Partner Equity Dividends

Using the Partner Equity Split slider on the Operations tab, Arjun configured a 70/30 dividend structure with local franchise partners, ensuring franchisees remained motivated to grow daily sales.

Ananya’s F&B Business Masterclass: A Complete Classroom-to-Boardroom Audit

Ananya is an MBA student writing a capstone project on F&B unit economics. Follow her comprehensive audit as she tests sensitivities, solves Q&A matrices, and exports raw data.

Ananya’s business school professor gave her class a challenge: "Don't just turn in a theoretical business plan. Show me a model that survives rigorous stress-testing." Ananya used the Cafe Investment Analyzer for her final capstone thesis.

"In the classroom, we study theoretical ratios. Using a live simulator allowed me to see how a 5% increase in food costs impacts payback timelines in real time."

Step 1: Performing "What-If" Sensitivity Stress Tests

Ananya stress-tested her baseline model: What happens if coffee bean prices rise by 20%? She adjusted the target profit margin slider from 20% down to 14% and observed how payback extended from 14 months to 24 months.

Live UI Preview: Investment Query Matrix Solutions
Q4: Minimum Break-Even Sales Solved: ₹1,85,000/mo

Q12: Max Physical Capacity = ₹12L/mo. Q15: Annual Net Return = ₹6,00,000.

The Query Matrix provides instant solutions to 16 critical financial questions.

Step 2: Solving the Predefined Query Matrix

She navigated to the Investment Questions Grid and answered all 16 predefined financial queries (including Q4 Break-Even Sales and Q12 Maximum Physical Capacity), attaching the answers to her thesis defense.

The Peak-Hour Surge & Menu Engineering Matrix

Why a 50-item menu destroys peak-hour revenue. Discover how to engineer menu prep times (AOSd) to double transaction volume during morning rush hours.

Most cafe owners believe that offering a massive 50-item food and beverage menu attracts more customers. In reality, during the crucial 2-hour morning surge (8:00 AM to 10:00 AM), menu complexity creates a severe kitchen bottleneck. If your barista takes 8 minutes to prepare a single complex beverage, your queue backs up and morning commuters walk away.

"Menu complexity is the silent killer of peak-hour sales. Shaving 90 seconds off prep time doubles your revenue per square foot without increasing staff."

1. Menu Engineering Classification

To optimize throughput, divide your menu into two operational tiers:

  • Starters (High Margin / Fast Prep): Espresso, batch brews, croissants, pre-packaged bun maska. Prep time: 60 to 90 seconds.
  • Traps (Low Margin / Labor Heavy): Complex artisanal pour-overs, multi-topping cooked breakfasts. Prep time: 8 to 12 minutes.
Live UI Preview: Peak-Hour Capacity Optimization
Peak Surge Order Rate 🟢 Speed Optimized (3 mins)

2 Stations @ 3 mins prep = 40 orders/hr. Supporting ₹6,00,000/hr peak revenue ceiling at ₹150 AOV.

Streamlining prep times during peak hours maximizes transaction throughput.

2. Modeling Peak-Hour Revenue Ceilings

On the Sales & Margins tab, slide your AOSd (Average Order Service duration) from 8 minutes down to 3 minutes. The capacity engine reveals an immediate jump in hourly throughput from 15 to 40 orders per station: unlocking lakhs in hidden monthly revenue.

The Inflation & Supply Chain Stress-Testing Playbook

What happens when milk prices rise by 12% or coffee bean import tariffs shift? Learn how to stress-test your margins and protect net profitability.

In F&B management, external cost shocks are inevitable. Over a 3-year operating period, raw ingredient prices, commercial electricity rates, and local staff minimum wages will inevitably rise. A fragile business model fails when inflation hits; a stress-tested model adapts seamlessly.

"A business model that works only when costs are perfect is an accident waiting to happen. Build a 5% inflation buffer into your baseline."

1. Running Margin Sensitivity Audits

Open the global header and slide Expected Profit Margin (%) down from 20% to 15%. Observe how your payback timeline extends. The simulator reveals your exact cash cushion under inflationary pressure, proving whether your venture can survive a 5% margin squeeze.

Live UI Preview: Supply Chain Margin Stress-Test
Baseline Net Margin (20%)
₹1,60,000/mo
Stressed Net Margin (15%)
₹1,20,000/mo

Even under a 5% inflation margin squeeze, the business maintains a positive ₹1.2L net profit runway.

2. Three Lines of Defense Against Cost Spikes

  • Recipe Yield Optimization: Standardize barista milk steaming to eliminate milk waste.
  • Portion Control & Spoilage Audits: Track daily kitchen waste to recover 2-3% lost margin.
  • Strategic Price Ratios: Increase high-margin specialty items by ₹10 to absorb raw material price spikes without affecting volume.

The Exit Strategy & Business Valuation Masterclass

Building a cafe venture for a 4x–8x EBITDA valuation multiplier. Discover how to package your metrics for a profitable buyout or franchise exit.

True wealth in entrepreneurship is created not just from monthly cash flow, but from building a brand that can be sold for a high valuation multiple to private equity, restaurant groups, or strategic buyers.

"An investor buys your future EBITDA, not your past hard work. Build a business that runs on systems, not founder sweat."

1. How Buyers Calculate Cafe Valuation

Acquirers calculate business value using the EBITDA multiplier formula:

$$\text{Valuation} = \text{Normalized Annual EBITDA} \times \text{Valuation Multiplier (4x to 8x)}$$

A cafe generating ₹20,00,000 in annual net EBITDA at a 5x multiplier commands a ₹1 Crore cash buyout.

Live UI Preview: Valuation & M&A Buyout Metrics
Projected 5x EBITDA Valuation 🟢 ₹1.00 Crore Buyout

Normalized Annual EBITDA: ₹20,00,000. Customer LTV:CAC = 5.08x. Runway Buffer: 6.5 Months.

Documented unit economics and audited financial exports drive higher valuation multiples.

2. Packaging an M&A-Ready Data Room

  • Audited Financial Exports: Export full Excel workbooks showing historical cash flow consistency.
  • Unit Economic Proof: Demonstrate a stable LTV:CAC ratio (>4x) and a 3-month operating runway reserve.
  • Systemized Operations: Show that the store operates independently of the founder using tuned prep speeds (AOSd) and automated rules-based diagnostics.

The Master 9-Tab Strategy Guide: Navigating the Full Platform Cockpit

An executive mentorship roadmap: How Indian food & beverage entrepreneurs can connect every calculator, unit economic ratio, and advisor alert into a bulletproof business plan.

1. Capital Sizing
₹ Baseline & 60/40 Rule
2. Operational Limits
Stations · AOSd · Hours
3. Unit Economics
LTV · CAC · Burn · Runway
4. Stress-Testing
Q&A Sensitivity Matrix

Mentor Perspective: Why Indian Cafes Fail (And How to Protect Yourself)

According to National Restaurant Association of India (NRAI) industry surveys, over 65% of independent food and beverage outlets shut down within the first 18 months. The failure is rarely due to poor coffee or lack of passion. Instead, it stems from three predictable financial traps:

  1. The Upfront CapEx Trap: Spending 80% to 90% of total capital on luxury Italian espresso rigs and marble counters, leaving virtually zero cash runway for the slow opening months.
  2. The Aggregator Commission Bleed: Relying heavily on Swiggy and Zomato (50%+ order share) without factoring in their 18%–25% commission and packaging costs, which obliterates net profit margins.
  3. The Theoretical Bottleneck Blindspot: Setting aggressive sales targets (e.g., ₹15 Lakhs/month) with only 1 cashier station and a slow 8-minute preparation speed, resulting in long customer queues, walkouts, and lost revenue.

This platform serves as your financial and operational digital twin. Before you sign a commercial lease or transfer funds to equipment vendors, you can simulate and stress-test your business model across 9 integrated tabs.

The 9-Tab Strategic Walkthrough

Tab 1

Financial Cockpit (Dashboard)

Set your three global baseline parameters: Full Investment (₹), Expected Sales/Month (₹), and Expected Net Profit Margin (%). Immediately observe the Executive Investment Score (0–100) and Automated Advisor alerts detecting CapEx violations or bottleneck risks.

Tab 2

CapEx & Working Capital

Inspect the foundational 60% CapEx / 40% Operating Runway rule. Verify that your physical setup costs (Premises deposit, machinery, interior woodwork, exterior signage) do not cannibalize your 3-to-6 month working capital safety runway.

Tab 3

Sales Capacity & Margins

Dial in your operational throughput: Cashier Stations, Average Order Value (AOV), Avg Order Service Duration (AOSd), and Active Hours/Days. Compare your target sales against the Theoretical Operations Limit to ensure your kitchen can physically fulfill target demand.

Tab 4

Returns & Cumulative Payback

Analyze your Payback Period (Months) against target investor thresholds. Review the cumulative cash recovery curve, fixed vs. variable cost split, and the exact monthly revenue required to achieve operational break-even.

Tab 5

Business Health & Unit Economics

Track modern recurring metrics: Monthly Recurring Revenue (MRR), ARR, Customer Acquisition Cost (CAC), Customer Lifetime Value (LTV), and Cash Runway (Months). Ensure your LTV:CAC ratio stays safely above 3.0x.

Tab 6

Operations & Cost Allocation

Model real-world Indian operational expenses: Staff Headcount (0–20), Staff Avg Wages (₹1,000–₹1,00,000/mo), Delivery Aggregator Share % & Commission %, and Partner Equity Split (60:40).

Tab 7

Dynamic Query Matrix (Q&A)

Interactive sensitivity analysis solving 10 core "What-If" operational questions. Adjust dynamic sliders to see the exact impact on payback time, gross margins, and net profit in real time.

Tab 8

Reports & Data Room Export

Generate professional, investor-ready documentation: Instant print preview, 1-Click PDF Executive Summary, and CSV/Excel data room export for co-founders, banks, and angel investors.

Tab 9

Terminology & Glossary

Explore the master 50-parameter knowledge base with dual-view mode switcher (Tile Grid vs. Compact Accordion Table), mathematical formulas, strategic significance, and simplified real-world examples.

The First-Time Tech Founder: Launching an ₹18 Lakh Specialty Kiosk in Bangalore

How a senior software engineer turned savings into a profitable grab-and-go specialty coffee bar in HSR Layout using the 60/40 capital rule and solo-founder modeling.

1. The Founder Persona & Dilemma

Founder: Rohan, 29, Senior UI/UX Engineer in Bangalore.
Available Capital: ₹18,00,000 (accumulated personal savings and tech bonus).
Target Concept: 250 sq.ft. grab-and-go specialty espresso and cold-brew kiosk in HSR Layout Sector 4, targeting IT professionals and startup employees.

The Initial Challenge: Rohan was initially tempted by a commercial contractor quote for a ₹15 Lakh luxury fit-out with imported dual-boiler machines. Had he signed that contract, he would have had only ₹3 Lakhs left for rent deposits, inventory, and working capital: putting him just 30 days away from running out of cash if opening sales were slow.

2. Step-by-Step Platform Walkthrough & Sizing

Platform Configuration · Bangalore Kiosk Status: Highly Feasible
Full Investment
₹18,00,000
Expected Sales / Month
₹6,50,000
Expected Profit Margin
20.0%
Calculated Payback
13.8 Months

A. Tab 2 (CapEx & Working Capital): Enforcing the 60/40 Rule

Using Tab 2, Rohan allocated his capital strictly under the platform's 60/40 benchmark:

  • One-Time CapEx Setup (60%): ₹10,80,000.
    • Commercial Machinery: ₹3,00,000 (Refurbished 2-Group Italian machine + On-Demand grinder).
    • Premises Advance: ₹1,80,000 (3 months refundable deposit at ₹60,000/mo rent).
    • Interior Woodwork & Counter: ₹2,40,000 (Modular metal and pine wood counter).
    • Exterior Backlit Board & Signage: ₹60,000.
    • Tools & Barista Accessories: ₹40,000.
    • Emergency & Backup Reserves: ₹60,000.
  • Operating Runway Reserve (40%): ₹7,20,000. This guaranteed Rohan 4.8 months of operational runway to cover all fixed costs even with zero opening-day sales.

B. Tab 3 (Sales Capacity): Verifying Throughput

  • Cashier Stations: 1 station.
  • Avg Order Service Duration (AOSd): 4.0 minutes → 15 orders/hour max capacity.
  • Active Hours: 12 hours/day (7:30 AM to 7:30 PM).
  • Operating Days: 26 days/month (Closed on alternate Mondays).
  • Average Order Value (AOV): ₹185 (Specialty beverage ₹150 + cookie ₹35).
  • Theoretical Operations Limit: ₹8,65,800/month. Rohan's target of ₹6,50,000 represents 75% capacity utilization: healthy and achievable without counter congestion.

C. Tab 6 (Staff Modeling): Zero-Staff Founder Mode

For the first 60 days, Rohan managed the POS and morning brewing himself, hiring only 1 junior barista at ₹18,000/month. The platform's expanded staff wage support allowed him to model part-time wages accurately, keeping total monthly payroll at ₹26,000 (just 4% of sales).

3. The Outcome & Mentor Takeaways

Key Results: Monthly Net Profit stabilized at ₹1,30,000/month. Payback period was locked at 13.8 Months. Investment Attractiveness Score scored 84/100 (Grade A · Strong).

The Multi-Unit Restaurant Operator: Launching an Express Coffee Vertical in Pune

How an established casual dining brand expanded into high-margin express coffee kiosks using Tier 2 regional multipliers and central commissary synergies.

1. The Expansion Scenario

Operators: Sunita & Vikram, co-founders of two successful casual dining restaurants in Pune (Koregaon Park & Kothrud).
New Project Budget: ₹28,00,000 for a new express coffee and bakery kiosk inside a prime Baner commercial IT park.
Key Objective: Monetize daytime coffee breaks, capture morning pastry commuters, and test an express kiosk format with an 11-month target payback.

2. Step-by-Step Platform Walkthrough

Step 1

Regional Location Multiplier

In Tab 2, they selected Tier 2 Target (Pune · 1.0x Multiplier). Unlike Mumbai or Delhi (1.6x Metro), Pune real estate allowed them to secure a 350 sq.ft. commercial lease deposit for ₹2,40,000 (4 months at ₹60,000/mo), saving ₹1,80,000 upfront.

Step 2

Central Kitchen Synergies

Because pastries and cold brew batches were prepared in their existing restaurant commissary, on-site CapEx was reduced. They dialed Interior to ₹3,20,000 and Machinery to ₹4,20,000, shifting ₹3,00,000 directly into their opening liquidity buffer.

Step 3

Dual-Station Throughput

In Tab 3, they set 2 Cashier Stations with an optimized AOSd of 3.0 minutes (20 orders/hr/station). With 30 operating days and 14 active hours, their peak monthly capacity expanded to ₹23,52,000: easily accommodating their ₹11,00,000 sales target.

Step 4

Staff Payroll Optimization

In Tab 6, they configured 4 full-time baristas on rotating shifts at an average wage of ₹20,000/month. Total payroll of ₹80,000 represented only 7.2% of projected monthly sales, well below the 15% industry ceiling.

3. Financial & Return Metrics

  • Full Investment: ₹28,00,000.
  • Expected Monthly Sales: ₹11,00,000.
  • Net Profit Margin: 22.0% (₹2,42,000/month net profit).
  • Calculated Payback Period: 11.6 Months (Beating their 12-month internal investment hurdle).
  • Investment Attractiveness Score: 89/100 (Grade A+ · Excellent).

Overhauling a Bleeding Outlet: Turning a Bandra Cafe from -8% to +18% Net Profit

A real-world turnaround masterclass: How an operator diagnosed negative margins, broke the 62% aggregator commission trap, rationalized payroll, and restored healthy cashflow.

1. The Distress Situation

Operator: Arjun, 34, took over management of an underperforming 45-seat cafe in Bandra West, Mumbai.
The Problem: The cafe was generating ₹6,50,000 in monthly sales but incurring ₹7,02,000 in monthly expenses: resulting in a monthly cash bleed of -₹52,000 (-8.0% Net Margin). Liquid bank reserves had dwindled to ₹95,000 (less than 1.8 months of runway before bankruptcy).

2. The Diagnostic Phase (Dashboard & Operations Analysis)

Using the platform's diagnostic dashboards, Arjun uncovered three critical profit leaks:

  1. The 62% Aggregator Trap: 62% of all orders came through Swiggy and Zomato at an average commission of 22%. In addition, disposable packaging added ₹38,000/month. The cafe was paying ₹88,660 in commissions + ₹38,000 in packaging every month: effectively transferring all operational profits to third-party delivery platforms.
  2. Overstaffing on Slow Shifts: The cafe employed 7 full-time staff members at ₹20,000/month average wage (Total Payroll = ₹1,40,000/month, or 21.5% of sales), despite low afternoon footfall.
  3. Sub-Optimal Ticket Size (AOV): Average order value was just ₹155 (customers ordering single Americanos with free Wi-Fi for 3 hours).

3. The 4-Step Strategic Turnaround Plan

Action 1

In-Store Shift & AOV Expansion

Shifted marketing from aggregator discounts to in-store experience. Introduced artisanal sourdough sandwich and specialty pour-over combos, raising AOV from ₹155 to ₹265 (+71% ticket growth). Reduced delivery share from 62% down to 25%.

Action 2

Payroll Rationalization

Cross-trained staff and adjusted shift schedules. Reduced headcount from 7 to 4 full-time equivalents (FTE), trimming monthly payroll from ₹1,40,000 to ₹80,000 (a direct monthly cash savings of ₹60,000).

Action 3

Energy & Utility Audit

Identified an obsolete continuous-run display refrigerator consuming excessive electricity. Replaced it with an energy-efficient inverter unit, reducing monthly electricity from ₹48,000 to ₹34,000 (saving ₹14,000/month).

Action 4

Supplier Cost Renegotiation

Consolidated dairy and specialty coffee bean purchasing to weekly bulk schedules, negotiating a 9% volume discount that improved gross margins from 72% to 81%.

4. The Turnaround Transformation Results

Metric Before Turnaround After Turnaround Strategic Impact
Monthly Sales ₹6,50,000 ₹8,20,000 +26.1% revenue growth
Delivery Share 62% 25% Eliminated ₹55,000/mo commission loss
Monthly Payroll ₹1,40,000 ₹80,000 Saved ₹60,000/month
Net Profit / Month -₹52,000 (-8.0%) +₹1,47,600 (+18.0%) Positive cashflow restored
Runway Buffer 1.8 Months (Critical) Infinite (Profitable) Solvency guaranteed

The Corporate Switcher & NRI Investor: Structuring a ₹50 Lakh Flagship in Hyderabad

How returning NRI tech executives structured co-founder equity, stress-tested 30% sales downturns, and built an investor-ready experiential cafe in Jubilee Hills.

1. The Founder Background & Capital Structure

Founders: Priya & Anand, former tech management consultants returning to India after 8 years in Singapore.
Total Capital Deployed: ₹50,00,000 (₹30L from operating partner Priya; ₹20L from passive investor Anand).
Equity Split: Partner A (60%) · Partner B (40%).
Location: 1,400 sq.ft. heritage villa conversion in Jubilee Hills Road No. 36, Hyderabad.

2. Step-by-Step Platform Walkthrough & Risk Governance

Stage 1

Tier 1 Metro CapEx Multiplier

In Tab 2, they modeled under the 1.6x Tier 1 Multiplier. Commercial real estate in Jubilee Hills required a 6-month lease deposit of ₹6,00,000 (at ₹1,00,000/mo rent). Setup CapEx totaled ₹30,00,000 (60%), leaving a substantial ₹20,00,000 (40%) operating runway reserve.

Stage 2

Experiential Menu & AOV Sizing

In Tab 3, they configured 2 high-speed workstations, artisanal pour-over bars, and gourmet sourdough platters, locking an AOV of ₹340. Target monthly sales of ₹16,50,000 represented 52% of maximum theoretical capacity (₹31,70,000).

Stage 3

Partner Dividend Distribution

In Tab 6, with expected sales of ₹16,50,000 and a 21.0% net margin, monthly net profit totaled ₹3,46,500/month. The platform automatically calculated the equity dividend payouts: Partner A (60%): ₹2,07,900/mo and Partner B (40%): ₹1,38,600/mo.

Stage 4

Dynamic Sensitivity Stress-Testing

In Tab 7 (Q&A Matrix), they simulated Question 1: "What happens if opening sales are 30% below target (₹11.55 Lakhs instead of ₹16.5 Lakhs)?" The calculation proved that even under a 30% revenue drop, the cafe generates ₹1,61,000/month in net profit, maintaining positive cashflow and zero insolvency risk.

3. Financial Performance Summary

  • Full Investment Capital: ₹50,00,000.
  • Expected Monthly Sales: ₹16,50,000.
  • Monthly Net Profit: ₹3,46,500 (21.0% Margin).
  • Payback Period: 14.4 Months (Recovering full ₹50L capital within 1.2 years).
  • Cash Runway Buffer: 5.8 Months of complete fixed-cost coverage.
  • Investment Attractiveness Score: 87/100 (Grade A · Strong Profile).
User Intelligence & Feedback Hub ⭐ 4.9 / 5.0 Rating

Feedback & Suggestions

Help us shape the future of the Café Investment Analyzer. Your ratings, bug reports, and strategic feature requests directly drive continuous updates.

Overall Satisfaction Score 4.9 / 5.0
Total Submissions 34 Submissions
Community NPS Index +86 Excellent
Section 1

Guided Feedback & Evaluation

Select quick options to rate your experience (70%–90% fast choices).

Section 2

Unguided Feedback & Custom Comments

Share your detailed thoughts, custom requests, or specific observations.

Verified Community Feedback & Testimonials

Real inputs and feature ideas shared by cafe founders, investors, and operators.

🔐

Owner Admin Control Center

Manage, moderate, hide, delete, or export all user feedback submissions privately.

Compliments & Praise 0
Feature Requests 0
Visual & UX Ideas 0
Calculation Checks 0
Bug Reports 0
When set, visitor submissions will be automatically forwarded to your email inbox when hosted live.

Legal Disclaimer & Terms of Use

Explicit platform boundaries, decision-support principles, client-side data security, and professional advisory guidelines.

⏳ Pending Acknowledgment
⚠️

Critical Advisory & Simulation Engine Boundary Notice

The Café Investment Analyzer functions strictly as an interactive mathematical simulation and algorithmic decision-support tool. All financial output numbers, cash flow forecasts, break-even timelines, unit economics metrics, and ROI calculations are deterministic approximations generated from user inputs and default baseline parameters. They do not constitute audited financial reporting, legal warranties, tax advice, or guaranteed commercial earnings.

Terms Acknowledgment & Responsible Usage Agreement

By utilizing this tool for business modeling, you acknowledge that calculations must be validated independently through market surveys, local real estate audits, and certified professional advisors (CAs/CFPs).

Comprehensive 10-Point Governance Matrix

Hover over or review each dedicated policy clause governing platform utilization.

01 📊

Purpose & Educational Scope

Provided strictly for educational exploration, preliminary feasibility studies, scenario modeling, and digital sandbox testing by prospective cafe founders, entrepreneurs, and investors.

02 📉

Accuracy & Mathematical Limitations

Projections are mathematical approximations dependent on user-supplied variables and static heuristics. Financial models do not guarantee future commercial success, footfall, or revenues.

03 🏛️

No Fiduciary Relationship

Using this web application, calculating ratios, or configuring custom parameter weights does not establish any consultant, fiduciary, broker, or legal advisory relationship between user and developer.

04 🔒

Data Privacy & Zero Tracking Guarantee

Operates 100% locally within your browser session using localStorage / sessionStorage. Your financial models, custom parameters, and inputs are never transmitted to external servers. Read Full Privacy Policy →

05 🤝

Third-Party Platform References

Trademarks and references to third-party services (Swiggy, Zomato, ONDC, etc.) serve solely as illustrative operational examples for commission modeling and imply no endorsement or official affiliation.

06 🤖

Algorithmic Calculation Engine

All dashboard diagnostic checks, LTV:CAC ratios, capacity throughput metrics, and weighted scores are deterministic algorithmic outputs rather than human-audited financial reports.

07 📈

Market & Location Variability

Acknowledges significant micro-economic variances across cities, Tier 1/2/3 regions, real estate commercial rentals, local customer footfall patterns, and seasonal demand swings.

08 ⚖️

CA & CFP Advisory Recommendation

Strongly urges all users to verify simulation outputs with a licensed Chartered Accountant (CA), Certified Financial Planner (CFP), or legal expert before making capital commitments.

09 ⏱️

Version & Baseline Assumptions

Default benchmark rates (e.g. 18% aggregator commission, 35% food cost ratio, 60/40 capital allocation rule) reflect industry default benchmarks and are subject to change as market conditions evolve.

10

Formal Acceptance & AI Decision Terms

Continued use of this application constitutes full acceptance of these terms, agreeing that creators bear no financial or legal liability for business operational decisions or outcomes.

🔒 Client-Side Trust & Governance Architecture

Privacy Policy & Data Protection

A transparent, zero-telemetry operational framework engineered to ensure 100% data confidentiality for your proprietary café recipes, financial projections, and capital models.

Version 2.4 • DPDP & GDPR Compliant
🛡️
100% Local Browser Execution Zero Remote Telemetry • No Server Logging
💾
Client Sandboxed Storage Isolated in device localStorage
🚫
0 Tracking Beacons No Meta Pixels • No Marketing Cookies
In-Memory PDF/Excel Blob Instant RAM generation • Zero Server Storage

Your Data, Unconditionally Under Your Control

You can download a complete backup of your saved settings and custom parameters, or immediately purge all cached data from this browser session.

01 Architecture

Zero-Knowledge & 100% Client-Side Computation

Café Investment Analyzer is engineered with a strict Local-First, Zero-Server Transmission computing architecture. All complex formulas, including CapEx sizing, recipe-level COGS, seating rush bottlenecks, 5-year break-even horizons, and custom weighting matrices, are processed entirely inside your local browser runtime (Google V8 / Apple WebKit). Your proprietary numbers and investment strategies are never transmitted to, monitored by, or hosted on any remote application server.

02 Storage & Scope

Types of Data Processed & Scoped Boundaries

The application interacts exclusively with two categories of data:
Operational Modeling Parameters: Numerical inputs (total capital, expected sales, footfall, barista wages, ingredient prices) stored strictly in client-side volatile memory and persistent localStorage.
Voluntary Feedback: If and only if you explicitly choose to submit feedback via the Community Suggestions tab, your typed notes and optional rating are sent securely via modern HTTPS endpoints.

03 Storage & Cookies

Local Storage Governance & Instant Data Erasure

We utilize standard HTML5 Web Storage API (localStorage) strictly to preserve your user preferences across visits (such as selected theme, active simulation mode: Beginner / Adaptive / Pro, and customized baseline amounts). No cross-domain identifiers or device fingerprinting keys are generated. You retain complete sovereignty: you may instantly wipe all stored simulation records at any time using our one-click Purge tool above or through standard browser settings.

04 Storage & Cookies

Zero Advertising Trackers & Cookie Exemption

This platform operates with Zero Commercial Tracking. We do not integrate advertising trackers, behavioral profiling scripts, retargeting beacons, or marketing cookies (including Meta Pixel, TikTok Pixel, Google Ads Remarketing, or Taboola). We do not monetize your data, sell lead profiles to commercial lenders, or broker financial inquiries to third parties.

05 Exports & Ownership

In-Memory Report Generation (PDF, Excel & CSV)

When exporting financial dossiers, executive summaries, or custom parameter schedules in PDF, Excel (XLSX), or CSV format, all documents are generated on-the-fly directly inside your browser memory using client-side libraries (jsPDF, SheetJS). No server-side document rendering pipeline exists; the compiled document is passed directly to your local file system via standard Blob URLs and immediately released from memory.

06 Exports & Ownership

Proprietary Business IP & Model Ownership

You retain 100% Unconditional, Exclusive Ownership of all business plans, financial projections, menu structures, margin formulas, and custom operational parameters configured on the platform. The application claims no intellectual property rights, licenses, or future equity claims over any commercial concept or financial strategy tested within this simulator.

07 Architecture

Static Content Delivery Networks (CDNs) & Isolation

Third-party static resources (such as Google Web Fonts, FontAwesome icons, and Chart.js visualization libraries) are loaded via high-availability Content Delivery Networks (CDNs) solely to optimize caching and page load speeds. CDNs only receive standard HTTP request headers required for file delivery; they have no visibility or programmatic access to any financial data processed within the application scripts.

08 Legal & Rights

DPDP Act 2023, GDPR & CCPA Privacy Rights

Our data minimization and local-first architecture inherently exceeds the requirements of global privacy legislation, including the Indian Digital Personal Data Protection Act (DPDP 2023), EU General Data Protection Regulation (GDPR), and the California Consumer Privacy Act (CCPA). Because personal data is neither collected nor remotely stored, your fundamental rights to access, rectification, portability, and absolute erasure are built directly into your own browser controls.

09 Legal & Rights

Security Safeguards & Offline Integrity

All web interactions are secured using modern Transport Layer Security (TLS 1.3 / HTTPS) with strict HTTP Content-Security-Policies. The simulation engine is designed to operate completely offline once cached, ensuring that even if your internet connection disconnects, all calculations, charts, and sensitivity tuners continue functioning securely within your local hardware sandbox.

10 Legal & Rights

Policy Governance, Modifications & Privacy Contact

We maintain transparent revision governance. Any future functional additions that modify how parameters are stored or processed will be documented with updated version logs. For inquiries regarding platform privacy architecture, technical security audits, or data protection questions, please reach out via our community Feedback channel or developer contact portal.

⚙️ Global Preferences & UI/UX Customization Engine

Settings & Personalization Hub

Customize visual aesthetics, Apple-grade interface modes, typography pairings, and analysis persona experience.

🎨

Master Visual Theme

Select an Apple-inspired theme or modern minimalist palette for your simulation cockpit & analysis workspace (Home page retains signature luxury styling).

Champagne Gold Signature Luxury
Homies Cream Warm Neo-morphic
Frosted Glass Iridescent Clay
Cupertino Studio Minimalist Silver
Nordic Frost Arctic Cyan
🔤

Minimalist Typography & Font Pairing

Select a curated modern, thought-provoking font combination from the minimalist reference series. Changes apply instantly across the entire platform with zero blind spots.

New York / Paris Metropolis • Mulish Light ⚡ Cupertino Tech Minimalist
Macau / Antalya Forum • Mako Regular 🏛️ Editorial Boutique
Prague / Amsterdam Play • Varela Regular 📈 Solution Terminal
Shanghai / Paris Voces • Mulish Sans ☕ Avant-Garde Roastery
Royal Champagne Marcellus • Plus Jakarta 🏆 Signature Luxury
🎓

Analysis Persona Mode

Switch dashboard depth between beginner guidance, balanced adaptive, and institutional specialist.

Active Mode Determines visible tools and granularity
Educational Formula Tooltips Show step-by-step math breakdowns on hover
🔊

Interactive Audio & Haptic Cues

Subtle synthesized Apple-style clicks, chimes, and interaction feedback.

Interface Sound FX Synthesized Web Audio clicks and milestone chimes
Audio Feedback Test Verify synthesized sound in your browser